NorwayThe construction market weakened inNorway during <strong>2000</strong>, and it is anticipatedthat construction investments will decreaseduring 2001 as well. This applies especiallyto commercial space and civil constructionprojects.FinlandDuring <strong>2000</strong>, Finland had a continued strongconstruction market, especially for residentialand commercial space. The market is expectedto remain strong during 2001 as well, althoughthe growth rate may be somewhat slower.Czech RepublicThe Czech construction market developedfavorably during <strong>2000</strong>, and the market forcivil construction projects is expected to growduring the next few years.DenmarkThe Danish construction market weakenedduring <strong>2000</strong> and is projected to remain weakduring 2001, especially in civil construction.However, the market for commercial space isexpected to grow during the next few years.PolandThe Polish construction market is showinghigh growth. Within a few years it is expectedto be one of the larger construction marketsin Europe. This trend is naturally affected toa great extent by Poland’s planned EU membership.Hong KongThe outlook for Gammon, <strong>Skanska</strong>’s halfownedcompany in Hong Kong, is consideredgood during 2001. Forecasts of market conditionsare optimistic.ArgentinaArgentina’s economic situation has been weakin recent years. Conditions recently stabilized,however, and there is cautious optimism concerningconstruction investments during 2001.Project DevelopmentThe demand for commercial space remainsstrong in the markets where <strong>Skanska</strong> has projectdevelopment business. <strong>Skanska</strong> ProjectDevelopment is currently pursuing 23 projects,17 of them in Sweden. Projects in Stockholmmake up nearly two thirds of expected investmentvolume.About 60 percent of the space in ongoingprojects has been pre-leased. During <strong>2000</strong>,value growth was 10 percent for comparableunits in <strong>Skanska</strong>’s real estate portfolio.Continued high turnover in the portfolio isexpected during the coming year.In the short term, <strong>Skanska</strong>’s BOT projectwill not generate any contribution to theearnings of <strong>Skanska</strong> Project Development,because these projects are in the constructionphase or were recently placed in service.New businesses<strong>Skanska</strong> Services works in different geographicmarkets with varying degrees of maturity.Over the next few years, more and morecompanies are expected to divest or to phaseout their internal service functions and insteadoutsource such services. This trend is expectedto generate rapid growth for facilities management,especially in the Nordic markets.<strong>Skanska</strong> Telecom Networks operates in arapidly growing sector with strong underlyinggrowth. The growth rate in the near futurewill be affected, among other things, by thepace of construction of the third-generationmobile telecommunications network in Europe.<strong>Skanska</strong>’s main markets, <strong>2000</strong>GDP growth, Market size, Market growth, <strong>Skanska</strong>’s growth, EstimatedMarket % SEK bn % % market share, %United States 5.0 8,203 7 42 1Sweden 4.0 116 6 12 12Great Britain 3.0 905 5 » 1 1Norway 2.2 103 –1 » 1 7Finland 5.4 108 6 7 6Czech Republic 2.5 40 5 » 1 14Denmark 2.8 113 5 26 5Poland 4.9 174 8 » 1 3Hong Kong 9.0 155 6 » 1 3Argentina 2.0 292 –5 –7 1Sources: Swedish Construction Federation et al, Byggkonjunkturen i Norden, No. 2, <strong>2000</strong>; OECD, Economic Outlook, No. 68, December<strong>2000</strong>, for both historic figures and forecasts; Norwegian historic figures (source Statistics Norway); U.S. historic figures (source Bureauof Economic Analysis); U.S. Census; Euroconstruct; Hong Kong Government; Engineering News Record, December 4, <strong>2000</strong>.1 » is larger than 200 percent.Investment propertiesSEK bn <strong>2000</strong> 1999 1998Market value 1 12.4 13.2 11.6Book value 6.3 6.9 6.4Surplus value 6.1 6.3 5.21 Estimated in collaboration with outside appraisers, withDecember 31, <strong>2000</strong> as the appraisal date.Return on real estate investmentin Project Development 1% <strong>2000</strong> 1999 1998Total return 18 19 18of which, change in value 9 9 111 Including operating net and change in value of investmentproperties plus development gains on fully developed properties.20 MARKET REVIEW <strong>Skanska</strong> <strong>Annual</strong> <strong>Report</strong> <strong>2000</strong>
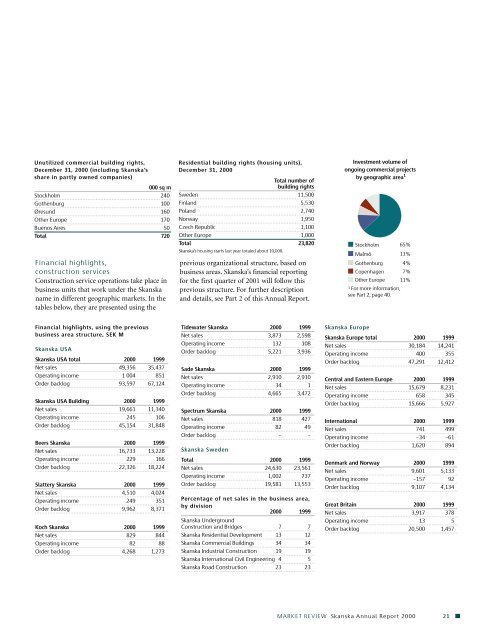
Unutilized commercial building rights,December 31, <strong>2000</strong> (including <strong>Skanska</strong>’sshare in partly owned companies)000 sq mStockholm 240Gothenburg 100Øresund 160Other Europe 170Buenos Aires 50Total 720Financial highlights,construction servicesConstruction service operations take place inbusiness units that work under the <strong>Skanska</strong>name in different geographic markets. In thetables below, they are presented using theResidential building rights (housing units),December 31, <strong>2000</strong>Total number ofbuilding rightsSweden 11,500Finland 5,530Poland 2,740Norway 1,950Czech Republic 1,100Other Europe 1,000Total 23,820<strong>Skanska</strong>’s housing starts last year totaled about 10,000.previous organizational structure, based onbusiness areas. <strong>Skanska</strong>’s financial reportingfor the first quarter of 2001 will follow thisprevious structure. For further descriptionand details, see Part 2 of this <strong>Annual</strong> <strong>Report</strong>.Investment volume ofongoing commercial projectsby geographic area 1StockholmMalmöGothenburgCopenhagenOther Europe1 For more information,see Part 2, page 40.65%13%4%7%11%Financial highlights, using the previousbusiness area structure, SEK M<strong>Skanska</strong> USA<strong>Skanska</strong> USA total <strong>2000</strong> 1999Net sales 49,356 35,437Operating income 1 004 851Order backlog 93,597 67,124<strong>Skanska</strong> USA Building <strong>2000</strong> 1999Net sales 19,661 11,340Operating income 245 106Order backlog 45,154 31,848Beers <strong>Skanska</strong> <strong>2000</strong> 1999Net sales 16,733 13,228Operating income 229 166Order backlog 22,326 18,224Slattery <strong>Skanska</strong> <strong>2000</strong> 1999Net sales 4,510 4,024Operating income 249 351Order backlog 9,962 8,371Koch <strong>Skanska</strong> <strong>2000</strong> 1999Net sales 829 844Operating income 82 88Order backlog 4,268 1,273Tidewater <strong>Skanska</strong> <strong>2000</strong> 1999Net sales 3,873 2,598Operating income 132 108Order backlog 5,221 3,936Sade <strong>Skanska</strong> <strong>2000</strong> 1999Net sales 2,910 2,910Operating income 34 1Order backlog 4,665 3,472Spectrum <strong>Skanska</strong> <strong>2000</strong> 1999Net sales 818 427Operating income 82 49Order backlog – –<strong>Skanska</strong> SwedenTotal <strong>2000</strong> 1999Net sales 24,630 23,561Operating income 1,002 737Order backlog 19,581 13,553Percentage of net sales in the business area,by division<strong>2000</strong> 1999<strong>Skanska</strong> UndergroundConstruction and Bridges 7 7<strong>Skanska</strong> Residential Development 13 12<strong>Skanska</strong> Commercial Buildings 34 34<strong>Skanska</strong> Industrial Construction 19 19<strong>Skanska</strong> International Civil Engineering 4 5<strong>Skanska</strong> Road Construction 23 23<strong>Skanska</strong> Europe<strong>Skanska</strong> Europe total <strong>2000</strong> 1999Net sales 30,184 14,241Operating income 400 355Order backlog 47,291 12,412Central and Eastern Europe <strong>2000</strong> 1999Net sales 15,679 8,231Operating income 658 345Order backlog 15,666 5,927International <strong>2000</strong> 1999Net sales 741 499Operating income –34 –61Order backlog 1,620 894Denmark and Norway <strong>2000</strong> 1999Net sales 9,601 5,133Operating income –157 92Order backlog 9,107 4,134Great Britain <strong>2000</strong> 1999Net sales 3,917 378Operating income 13 5Order backlog 20,500 1,457MARKET REVIEW <strong>Skanska</strong> <strong>Annual</strong> <strong>Report</strong> <strong>2000</strong> 21