and a faster pace of project development contributedto the increase in earnings.Operating income, core operations, SEK MQuarterlyRolling 12 mo.2,5005,0002,0001,5001,00050000Q1 Q2 Q3 Q4 Q1 Q2 Q3 Q4-99 -99 -99 -99 -00 -00 -00 -00Operating income, rolling 12 monthsGain on sale of propertiesOperating income excludingproperty sales4,0003,0002,0001,000Income after financial items amounted to SEK8,531 M (6,862). Net financial items totaledSEK 1,341 M (–39). Capital gains on the saleof shares amounted to SEK 1,682 M. Thisincluded SEK 1,706 M from the sale of <strong>Skanska</strong>’sshareholding in SKF.Net interest items totaled SEK –397 M(–338). Net interest items were affected byhigher average net indebtedness during theyear. Dividends received fell from SEK 282 Mto SEK 41 M. Income after financial items incore operations rose by 68 percent, from SEK2,478 M to SEK 4,175 M. All business areasreported a positive trend of earnings, with theexception of <strong>Skanska</strong> Europe.The year’s tax expense amounted to 30 percentof income after financial items (36). Thelower tax rate for the year was explained by alower tax burden on divestment of non-coreassets than in the preceding year.Net profit for the year rose to SEK 5,953 M(4,281). Net profit per share increased to SEK53.60 (37.60).Properties in realestate operationsThe market situation for commercial andoffice space in the metropolitan regions wheremost of the Group’s properties are locatedremained good. Operating income on theGroup’s overall property portfolio amountedto SEK 2,441 M (1,313). The improvement inearnings was due to higher capital gains on thesale of fully developed properties, totaling SEK1,907 M (703).Operating net for investment propertiesamounted to SEK 807 M (778). This wasequivalent to an operating net margin ofabout 65 percent (66). The occupancy raterose to 93 percent (92) in terms of space and95 percent (94) in terms of rent.The assessment of the market value of theGroup’s investment properties on December31, <strong>2000</strong>, carried out partly in collaborationwith outside appraisers, showed an estimatedmarket value of SEK 12,400 M (13,200), ofwhich about SEK 200 M was related to <strong>Skanska</strong>’sholding in partly-owned properties. Thecorresponding book value in the consolidatedaccounts was about SEK 6,300 M (6,900).The continued good market situation in<strong>Skanska</strong>’s main markets for project developmentand real estate created opportunities toexpand the volume of project development.During the year, four real estate projects werecompleted and two of them were sold. Thebook value of the remaining completed projectswas about SEK 160 M.At year-end, the Group’s real estate operationsreported 23 ongoing real estate projects,17 of them in Sweden. Their book value aftercompletion is estimated at SEK 5,700 M. Atyear-end, their book value was about SEK2,700 M. Expected yield, based on book value,is estimated at 11 percent. About 60 percent ofthe space under construction has been preleased.For further information, see the tableson pages 34–35.Capital spendingThe Group’s capital investments totaled SEK16,551 M (8,866) during the year, while divestmentstotaled SEK 17,123 M (12,739). Netdivestments for the year thus amounted toSEK 572 M (3,873).The Group acquired SEK 6,010 M worth ofcompanies and divested SEK 8,512 M worth ofcompanies and shares. Among major acquisitionswere the British-based Kvaerner Construction,the Norwegian-based Selmer, theCzech company IPS and Poland’s Exbud, plusthe American companies Barclay White andBaugh. Divestments included the sale of holdingsin Piren, JM and SKF and the sale of componentcompanies.Investments/DivestmentsSEK M <strong>2000</strong> 1999InvestmentsProperties in real estate operations –2,446 –2,483Current-asset properties –5,219 –3,389Acquisitions of subsidiaries –6,010 –1,376Other fixed assets –2,876 –1,618Total investments –16,551 –8,866DivestmentsProperties in real estate operations 3,918 1,376Current-asset properties 4,249 2,332Businesses and shares 8,512 8,747Other divestments 444 284Total divestments 17,123 12,739Net divestments 572 3,873In its project development operations, <strong>Skanska</strong>carried out net divestments of SEK 502 Mduring the year. Among the divestments wereSEK 8,167 M worth of fully developed projects,while investments totaled SEK 7,665 M.This included projects in the Group’s realestate operations – which take place in the<strong>Skanska</strong> Project Development and Real Estatebusiness area – as well as current-asset properties,which refers to project developmentunder <strong>Skanska</strong>’s own auspices that takes placein other business areas.Investment in other fixed assets rose to SEK2,876 M (1,618). This was due to continuousreplacement investments in operations plusthe investment in Nobia AB shares, whichwere acquired in conjunction with the sale ofthe Poggenpohl Group.Cash flowSEK M <strong>2000</strong> 1999From business operations 2,368 3,199Taxes –1,021 –596From business operations, net 1,347 2,603Net divestments 572 3,873Of which, not affecting cash flow 1 527 –1,063Changes in financial receivables –812 114Taxes –880 –1,090From investment operations, net –593 1,834Dividends and buy-backsof <strong>Skanska</strong>'s own shares –4,430 –1,366Change in financial liabilities 4,779 –892Net change in minority interests –229 –91From financing operations, net 120 –2,349Cash flow for the year 874 2,0881 Refers to net unpaid investments/divestments during the year.The Group’s cash flow for the year was SEK874 M. This represented a decrease of SEK1,214 M from 1999. Total cash flow from businessoperations did not cover the dividendand <strong>Skanska</strong>’s buy-backs of its own shares,which meant that indebtedness increased.Cash flow from business operationsdecreased from SEK 2,603 M to SEK 1,347 M,or by SEK 1,256 M. About SEK 500 M of thedecrease was explained by lower dividendsreceived and by <strong>Skanska</strong>’s tax payment followinga court ruling in the Järnbron case, whichinvalidated the tax-free status of a 1987 dividendpaid to a former <strong>Skanska</strong> subsidiary. Theremainder of the decrease was attributable to<strong>Skanska</strong>’s now divested component operations.Cash flow from investment operationstotaled SEK –593 M (1,834). Compared to1999, paid net divestments decreased whilefinancial receivables rose. Taxes paid weremainly related to taxes on capital gains fromthe preceding year, for example on the sale of<strong>Skanska</strong>’s shareholding in Scancem and onreal estate divestments.Cash flow from financing operations duringthe year was SEK 120 M (–2,349). Thisamount includes a gross increase in liabilitiesof SEK 4,779 M to cover such items as the dividendand share buy-backs.REPORT OF THE DIRECTORS <strong>Skanska</strong> <strong>Annual</strong> <strong>Report</strong> <strong>2000</strong> 5
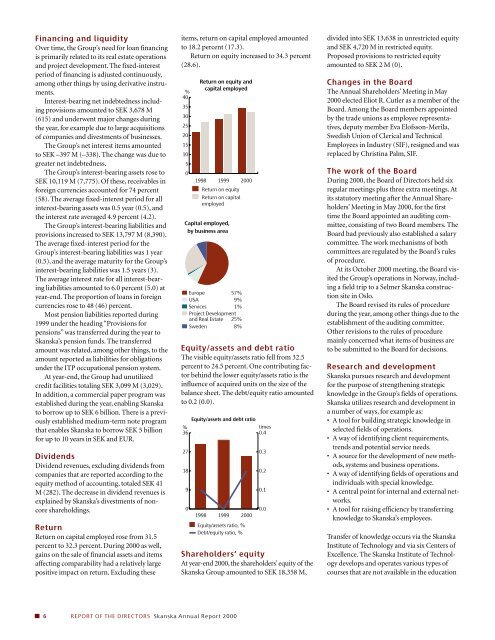
Financing and liquidityOver time, the Group’s need for loan financingis primarily related to its real estate operationsand project development. The fixed-interestperiod of financing is adjusted continuously,among other things by using derivative instruments.Interest-bearing net indebtedness includingprovisions amounted to SEK 3,678 M(615) and underwent major changes duringthe year, for example due to large acquisitionsof companies and divestments of businesses.The Group’s net interest items amountedto SEK –397 M (–338). The change was due togreater net indebtedness.The Group’s interest-bearing assets rose toSEK 10,119 M (7,775). Of these, receivables inforeign currencies accounted for 74 percent(58). The average fixed-interest period for allinterest-bearing assets was 0.5 year (0.5), andthe interest rate averaged 4.9 percent (4.2).The Group’s interest-bearing liabilities andprovisions increased to SEK 13,797 M (8,390).The average fixed-interest period for theGroup’s interest-bearing liabilities was 1 year(0.5), and the average maturity for the Group’sinterest-bearing liabilities was 1.5 years (3).The average interest rate for all interest-bearingliabilities amounted to 6.0 percent (5.0) atyear-end. The proportion of loans in foreigncurrencies rose to 48 (46) percent.Most pension liabilities reported during1999 under the heading “Provisions forpensions” was transferred during the year to<strong>Skanska</strong>’s pension funds. The transferredamount was related, among other things, to theamount reported as liabilities for obligationsunder the ITP occupational pension system.At year-end, the Group had unutilizedcredit facilities totaling SEK 3,099 M (3,029).In addition, a commercial paper program wasestablished during the year, enabling <strong>Skanska</strong>to borrow up to SEK 6 billion. There is a previouslyestablished medium-term note programthat enables <strong>Skanska</strong> to borrow SEK 5 billionfor up to 10 years in SEK and EUR.DividendsDividend revenues, excluding dividends fromcompanies that are reported according to theequity method of accounting, totaled SEK 41M (282). The decrease in dividend revenues isexplained by <strong>Skanska</strong>’s divestments of noncoreshareholdings.ReturnReturn on capital employed rose from 31.5percent to 32.3 percent. During <strong>2000</strong> as well,gains on the sale of financial assets and itemsaffecting comparability had a relatively largepositive impact on return. Excluding theseitems, return on capital employed amountedto 18.2 percent (17.3).Return on equity increased to 34.3 percent(28.6).%4035302520151050Capital employed,by business areaEquity/assets and debt ratioThe visible equity/assets ratio fell from 32.5percent to 24.5 percent. One contributing factorbehind the lower equity/assets ratio is theinfluence of acquired units on the size of thebalance sheet. The debt/equity ratio amountedto 0.2 (0.0).Equity/assets and debt ratio%times360.42718Europe57%USA9%Services1%Project Developmentand Real Estate 25%Sweden8%90Return on equity andcapital employed1998 1999 <strong>2000</strong>Return on equityReturn on capitalemployed1998199819991999<strong>2000</strong><strong>2000</strong>Equity/assets ratio, %Debt/equity ratio, %0.30.20.10.0Shareholders’ equityAt year-end <strong>2000</strong>, the shareholders’ equity of the<strong>Skanska</strong> Group amounted to SEK 18,358 M,divided into SEK 13,638 in unrestricted equityand SEK 4,720 M in restricted equity.Proposed provisions to restricted equityamounted to SEK 2 M (0).Changes in the BoardThe <strong>Annual</strong> Shareholders’ Meeting in May<strong>2000</strong> elected Eliot R. Cutler as a member of theBoard. Among the Board members appointedby the trade unions as employee representatives,deputy member Eva Elofsson-Merila,Swedish Union of Clerical and TechnicalEmployees in Industry (SIF), resigned and wasreplaced by Christina Palm, SIF.The work of the BoardDuring <strong>2000</strong>, the Board of Directors held sixregular meetings plus three extra meetings. Atits statutory meeting after the <strong>Annual</strong> Shareholders’Meeting in May <strong>2000</strong>, for the firsttime the Board appointed an auditing committee,consisting of two Board members. TheBoard had previously also established a salarycommittee. The work mechanisms of bothcommittees are regulated by the Board’s rulesof procedure.At its October <strong>2000</strong> meeting, the Board visitedthe Group’s operations in Norway, includinga field trip to a Selmer <strong>Skanska</strong> constructionsite in Oslo.The Board revised its rules of procedureduring the year, among other things due to theestablishment of the auditing committee.Other revisions to the rules of proceduremainly concerned what items of business areto be submitted to the Board for decisions.Research and development<strong>Skanska</strong> pursues research and developmentfor the purpose of strengthening strategicknowledge in the Group’s fields of operations.<strong>Skanska</strong> utilizes research and development ina number of ways, for example as:• A tool for building strategic knowledge inselected fields of operations.• A way of identifying client requirements,trends and potential service needs.• A source for the development of new methods,systems and business operations.• A way of identifying fields of operations andindividuals with special knowledge.• A central point for internal and external networks.• A tool for raising efficiency by transferringknowledge to <strong>Skanska</strong>’s employees.Transfer of knowledge occurs via the <strong>Skanska</strong>Institute of Technology and via six Centers ofExcellence. The <strong>Skanska</strong> Institute of Technologydevelops and operates various types ofcourses that are not available in the education6 REPORT OF THE DIRECTORS <strong>Skanska</strong> <strong>Annual</strong> <strong>Report</strong> <strong>2000</strong>