Five-year groupfinancial summaryPro forma 1 Pro forma 1SEK M <strong>2000</strong> 1999 1998 1997 1996Order bookings 127,031 97,332 77,383 58,950Order backlog 160,675 93,686 67,871 51,745Income statementsNet sales 108,022 79,128 62,435 49,577 37,844of which, outside Sweden, % 77 72 68 62 52Gross income 9,520 7,823 5,837 4,879 4,330Selling and administrative expenses –6,949 –5,564 –4,430 –4,244 –3,333Sale of properties 1,907 703 1,266 423 667Writedowns/reversals of writedowns 0 –5 –14 8 51Share of income in associated companies 299 657 684 674 524Items affecting comparability 2,413 3,287 1,033 –944 0Operating income 7,190 6,901 4,376 796 2,239Financial items 1,341 –39 449 9,316 1,761Income after financial items 8,531 6,862 4,825 10,112 4,000Taxes –2,532 –2,483 –1,965 –2,864 –517Minority interest in income –46 –98 –78 –122 –65Net profit for the year 5,953 4,281 2,782 7,126 3,418Cash flowFrom business operations 1,347 2,603 2,347From investment operations –593 1,834 –2,586From financing operations 120 –2,349 1,121Cash flow for the year 874 2,088 8821 For the years 1996 and 1997, pro forma figures are stated excluding the residential real estate company Drott and with JM deconsolidated.DefinitionsCapital employedDebt/equity ratioEquity/assets ratioEquity per shareInterest-bearing net indebtednessInterest coverNet profit per shareVisible shareholders' equity, minority interests plus interest-bearing liabilities and provisions.Interest-bearing net indebtedness divided by visible shareholders' equity including minority interests.Visible shareholders' equity including minority interests as a percentage of total assets.Visible shareholders' equity divided by the number of shares on the balance sheet date.Interest-bearing liabilities and provisions minus liquid assets and interest-bearing receivables.Operating income, financial revenues and net holdings in associated companies, as a percentageof average capital employed.Net profit for the year divided by the average number of shares.Number of shares outstanding Weighted average number of shares in <strong>2000</strong>: 111,157,356.Total number of shares at each year-end: <strong>2000</strong>: 106,536,268. 1997-1999: 113,854,968. 1996: 125,923,860.Operating net marginOperating net as a percentage of rental revenues.Operating net on propertiesRental revenues and interest subsidies minus operating, maintenance and administrative expenses aswell as real estate tax. Site leasehold rent is included in operating expenses.Return on capital employedOperating income, financial revenues and net holdings in associated companies, as a percentageof average capital employed.Return on shareholders' equityNet profit for the year as a percentage of average visible shareholders' equity.Yield on propertiesOperating net divided by year-end book value.26 FIVE-YEAR GROUP FINANCIAL SUMMARY <strong>Skanska</strong> <strong>Annual</strong> <strong>Report</strong> <strong>2000</strong>
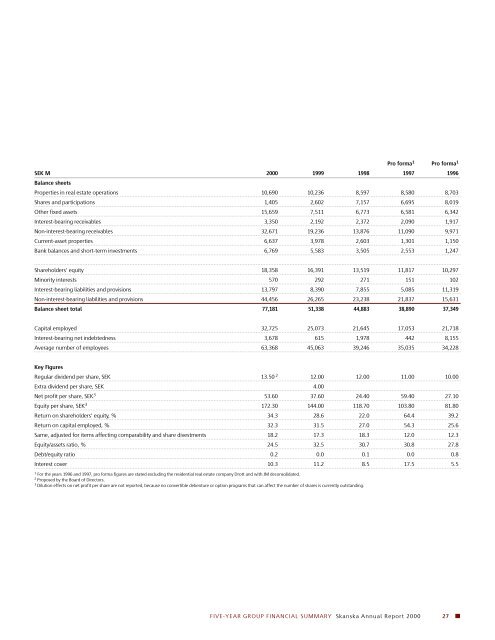
Pro forma 1 Pro forma 1SEK M <strong>2000</strong> 1999 1998 1997 1996Balance sheetsProperties in real estate operations 10,690 10,236 8,597 8,580 8,703Shares and participations 1,405 2,602 7,157 6,695 8,019Other fixed assets 15,659 7,511 6,773 6,581 6,342Interest-bearing receivables 3,350 2,192 2,372 2,090 1,917Non-interest-bearing receivables 32,671 19,236 13,876 11,090 9,971Current-asset properties 6,637 3,978 2,603 1,301 1,150Bank balances and short-term investments 6,769 5,583 3,505 2,553 1,247Shareholders' equity 18,358 16,391 13,519 11,817 10,297Minority interests 570 292 271 151 102Interest-bearing liabilities and provisions 13,797 8,390 7,855 5,085 11,319Non-interest-bearing liabilities and provisions 44,456 26,265 23,238 21,837 15,631Balance sheet total 77,181 51,338 44,883 38,890 37,349Capital employed 32,725 25,073 21,645 17,053 21,718Interest-bearing net indebtedness 3,678 615 1,978 442 8,155Average number of employees 63,368 45,063 39,246 35,035 34,228Key FiguresRegular dividend per share, SEK 13.50 2 12.00 12.00 11.00 10.00Extra dividend per share, SEK 4.00Net profit per share, SEK 3 53.60 37.60 24.40 59.40 27.10Equity per share, SEK 3 172.30 144.00 118.70 103.80 81.80Return on shareholders' equity, % 34.3 28.6 22.0 64.4 39.2Return on capital employed, % 32.3 31.5 27.0 54.3 25.6Same, adjusted for items affecting comparability and share divestments 18.2 17.3 18.3 12.0 12.3Equity/assets ratio, % 24.5 32.5 30.7 30.8 27.8Debt/equity ratio 0.2 0.0 0.1 0.0 0.8Interest cover 10.3 11.2 8.5 17.5 5.51 For the years 1996 and 1997, pro forma figures are stated excluding the residential real estate company Drott and with JM deconsolidated.2 Proposed by the Board of Directors.3 Dilution effects on net profit per share are not reported, because no convertible debenture or option programs that can affect the number of shares is currently outstanding.FIVE-YEAR GROUP FINANCIAL SUMMARY <strong>Skanska</strong> <strong>Annual</strong> <strong>Report</strong> <strong>2000</strong> 27