Assessing graduate screen production outputs in nineteen ...
Assessing graduate screen production outputs in nineteen ...
Assessing graduate screen production outputs in nineteen ...

Create successful ePaper yourself
Turn your PDF publications into a flip-book with our unique Google optimized e-Paper software.
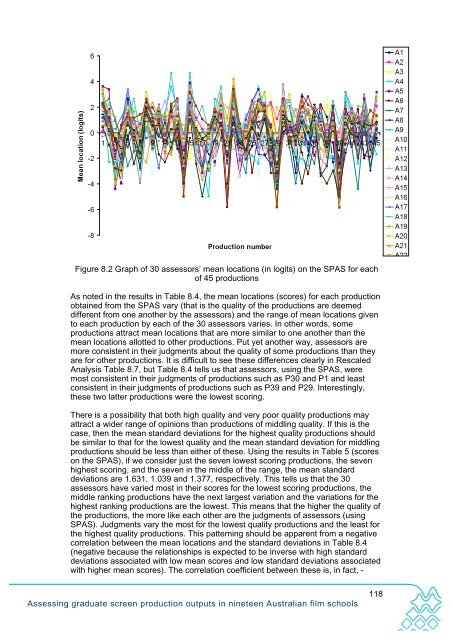
Figure 8.2 Graph of 30 assessors’ mean locations (<strong>in</strong> logits) on the SPAS for eachof 45 <strong>production</strong>sAs noted <strong>in</strong> the results <strong>in</strong> Table 8.4, the mean locations (scores) for each <strong>production</strong>obta<strong>in</strong>ed from the SPAS vary (that is the quality of the <strong>production</strong>s are deemeddifferent from one another by the assessors) and the range of mean locations givento each <strong>production</strong> by each of the 30 assessors varies. In other words, some<strong>production</strong>s attract mean locations that are more similar to one another than themean locations allotted to other <strong>production</strong>s. Put yet another way, assessors aremore consistent <strong>in</strong> their judgments about the quality of some <strong>production</strong>s than theyare for other <strong>production</strong>s. It is difficult to see these differences clearly <strong>in</strong> RescaledAnalysis Table 8.7, but Table 8.4 tells us that assessors, us<strong>in</strong>g the SPAS, weremost consistent <strong>in</strong> their judgments of <strong>production</strong>s such as P30 and P1 and leastconsistent <strong>in</strong> their judgments of <strong>production</strong>s such as P39 and P29. Interest<strong>in</strong>gly,these two latter <strong>production</strong>s were the lowest scor<strong>in</strong>g.There is a possibility that both high quality and very poor quality <strong>production</strong>s mayattract a wider range of op<strong>in</strong>ions than <strong>production</strong>s of middl<strong>in</strong>g quality. If this is thecase, then the mean standard deviations for the highest quality <strong>production</strong>s shouldbe similar to that for the lowest quality and the mean standard deviation for middl<strong>in</strong>g<strong>production</strong>s should be less than either of these. Us<strong>in</strong>g the results <strong>in</strong> Table 5 (scoreson the SPAS), if we consider just the seven lowest scor<strong>in</strong>g <strong>production</strong>s, the sevenhighest scor<strong>in</strong>g, and the seven <strong>in</strong> the middle of the range, the mean standarddeviations are 1.631, 1.039 and 1.377, respectively. This tells us that the 30assessors have varied most <strong>in</strong> their scores for the lowest scor<strong>in</strong>g <strong>production</strong>s, themiddle rank<strong>in</strong>g <strong>production</strong>s have the next largest variation and the variations for thehighest rank<strong>in</strong>g <strong>production</strong>s are the lowest. This means that the higher the quality ofthe <strong>production</strong>s, the more like each other are the judgments of assessors (us<strong>in</strong>gSPAS). Judgments vary the most for the lowest quality <strong>production</strong>s and the least forthe highest quality <strong>production</strong>s. This pattern<strong>in</strong>g should be apparent from a negativecorrelation between the mean locations and the standard deviations <strong>in</strong> Table 8.4(negative because the relationships is expected to be <strong>in</strong>verse with high standarddeviations associated with low mean scores and low standard deviations associatedwith higher mean scores). The correlation coefficient between these is, <strong>in</strong> fact, -<strong>Assess<strong>in</strong>g</strong> <strong>graduate</strong> <strong>screen</strong> <strong>production</strong> <strong>outputs</strong> <strong>in</strong> n<strong>in</strong>eteen Australian film schools118