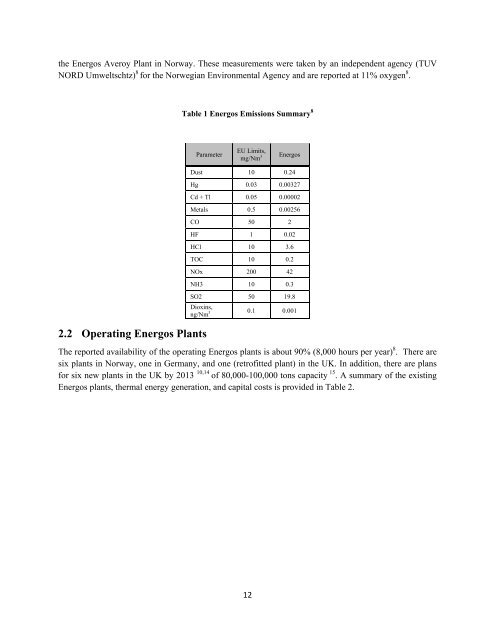
the Energos Averoy Plant in Norway. These measurements were taken by an independent agency (TUVNORD Umweltschtz) 8 for the Norwegian Environmental Agency and are reported at 11% oxygen 8 .Table 1 Energos Emissions Summary 8ParameterEU Limits,mg/Nm 3Energos2.2 Operating Energos PlantsDust 10 0.24Hg 0.03 0.00327Cd + Tl 0.05 0.00002Metals 0.5 0.00256CO 50 2HF 1 0.02HCl 10 3.6TOC 10 0.2NOx 200 42NH3 10 0.3SO2 50 19.8Dioxins,ng/Nm 3 0.1 0.001The reported availability of the operating Energos plants is about 90% (8,000 hours per year) 8 . There aresix plants in Norway, one in Germany, and one (retrofitted plant) in the UK. In addition, there are plansfor six new plants in the UK by 2013 10,14 of 80,000-100,000 tons capacity 15 . A summary of the existingEnergos plants, thermal energy generation, and capital costs is provided in Table 2.12
Table 2 Operating Energos Plants9, 10, 15PlantLocation(start upyear)Ranheim,Norway(1997)Averoy,Norway-NordmoreRegion(2000)Hurum,Norway(2001)Minden,Germany(2001)Forus,Norway-StavangerRegion(2002)Sarpsborg1, Norway(2002)Sarpsborg2, Norway(2010)<strong>Waste</strong> InputStreamsPaper millrejects + variouscommercialwastesMixed MSW +variouscommercialwastesMixed MSW +commercialwaste fromairport + paperrejects50% ResidualMSW + RDF(paper andplastic waste)Residual MSW+ commercialwastesMSW +commercialwastesMSW +commercialwastes<strong>To</strong>talAnnualCapacity,tons (no.of lines)ApproximateSite Area (m 2 ) 1Thermal<strong>Energy</strong>Produced(MWh/year)MWh,thper tonInvestmentper ton ofannualcapacity 2Investmentper MWh, thproduced10,000 (1) N.A. 25,000 2.5 $1,350 $54030000 (1) 6,000 69,000 2.3 $1,033 $45039000 (1) 6,000 105,000 2.7 $657 $23839000 (1) 6,000 105,000 2.7 $673 $24339000 (1) 6,000 105,000 2.7 $825 $31478000 (2) 9,000 210,000 2.7 $525 $19578000 (2) 9,000 256,000 3.3 $525 $1951Since site area is project specific, approximate site area has been estimated by use of the following data provided byEnergos: Single Line site area is 6,000 sq meters and double line site area is 9,000 sq meters. The data shown in this Tablewill be further refined during continuing thesis research.2 Assuming Investment per ton for Sarpsborg 2 Plant is the same as Sarpsborg 1.13
- Page 1 and 2: SMALL SCALE WASTE-TO-ENERGY TECHNOL
- Page 3 and 4: By assessing these small scale tech
- Page 5 and 6: LIST OF FIGURESFigure 1 Expanded Hi
- Page 7 and 8: 1 INTRODUCTION1.1 Current Status of
- Page 9 and 10: of plant capacity, technology, owne
- Page 11: Figure 2 Energos Gasifier and Therm
- Page 15 and 16: 2.4 Ownership and Operation of Exis
- Page 17 and 18: 2.5 The Energos Plant at Forus, Nor
- Page 19 and 20: 3 NOVO ENERGYNovo Energy is a WTE c
- Page 21 and 22: Steam Customer: 3 M Manufacturing &
- Page 23 and 24: 5 MODULAR AND MICROSCALE SYSTEMSThe
- Page 25 and 26: Figure 10 below shows both co-curre
- Page 27 and 28: Heat Production: 4.7 MW Power: 350
- Page 29 and 30: Figure 14 Energy’s Mobile GEM 3T1
- Page 31 and 32: 6 SMALL SCALE PLANTS STATISTICAL AN
- Page 33 and 34: 33%8% 5% Large Scale Sludge23%Small
- Page 35 and 36: It was demonstrated in Figure 19 be
- Page 37 and 38: In Figure 21, the cumulative % of h
- Page 39 and 40: In Figure 23, the cumulative % of s
- Page 41 and 42: It can be seen below in Figure 25 t
- Page 43 and 44: REFERENCES1. Van Haaren R, Themelis
- Page 45 and 46: 34. Spliethoff H. “Power Generati
- Page 47 and 48: Table 10 Analysis of All Data Compi
- Page 49 and 50: ALL - Operational Data, 2004Country
- Page 51 and 52: ALL - Operational Data, 2004Country
- Page 53 and 54: ALL - Operational Data, 2004Country
- Page 55 and 56: Italy Modena 122,042 5,000 4.10%Nor
- Page 57 and 58: Analysis of the same data showed th
- Page 59 and 60: Italy Dalmine BG) 137,500 24,200 17
- Page 61 and 62: Analysis of the same data showed th
- Page 63 and 64:
fuels) and landfill groundwater con
- Page 65:
References1. John R. Zaller, The Na