Analysis of the same data showed that twenty-four plants reported co-combustion of sludge fromwastewater treatment plants (Table 12). On the average, the sludge combusted by these plants amountedto close to 2% of the total feedstock.CountryTable 12 Co-Combustion of <strong>Waste</strong>water Sludge in EuropePlantName/Location<strong>To</strong>tal(tons/yr.)<strong>To</strong>nswastewatersludgeSludge as% of totalcombustedAustria Zwentendorf 323000 2300 0.71%Belgium Thurmaide 259,614 7,352 2.83%Denmark Hjørring 61,270 2,735 4.46%Denmark Hørsholm 109,493 137 0.13%France Besançon 50,000 6,000 12.00%France Arrabloy 53,707 3,091 5.76%FranceVillefranche sur 78,301 1,004 1.28%SaôneFrance Taden 103,200 9,525 9.23%France Cenon 134,242 11,104 8.27%France Thiverval-Grignon 191,000 5,600 2.93%FranceIssy-Les-537,094 532 0.10%MoulineauxFrance Saint Ouen 622,653 463 0.07%France Paris 690,123 990 0.14%Germany Völklingen 210,488 452 0.21%Germany Kamp-Lintfort 221,145 4,700 2.13%Germany Krefeld 346,231 16,873 4.87%Italy Macomer (NU) 79,000 500 0.63%Italy Verona 131,300 700 0.53%Italy Macchiareddu (CA) 212,600 9,000 4.23%Netherlands Roosendaal 55,166 99 0.18%Netherlands Amsterdam 877,351 23,981 2.73%Spain Palma De Mallorca 328,747 2,056 0.63%Sweden Halmstad 146,804 1,224 0.83%Switzerland Lausanne 120,000 6,000 5.00%<strong>To</strong>tal (24 plantsreporting)5,942,529 116,418 1.96%*Excludes sludge data from Greppin Germany as this plant does not co‐combust withhousehold waste.* *Switzerland, Lausanne reported wastewater sludge co‐combusted as percentagerange of 0‐10%. As such, an average of 5% was used to obtain a numerical value for tonsof sludge co‐combusted annually.56
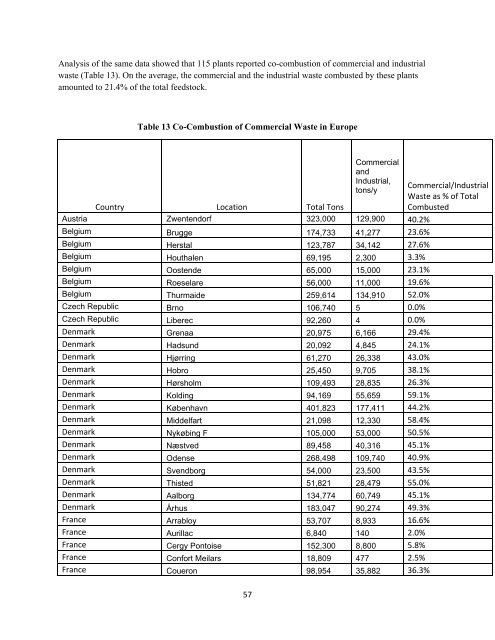
Analysis of the same data showed that 115 plants reported co-combustion of commercial and industrialwaste (Table 13). On the average, the commercial and the industrial waste combusted by these plantsamounted to 21.4% of the total feedstock.Table 13 Co-Combustion of Commercial <strong>Waste</strong> in EuropeCountry Location <strong>To</strong>tal <strong>To</strong>nsCommercialandIndustrial,tons/yAustria Zwentendorf 323,000 129,900 40.2%Belgium Brugge 174,733 41,277 23.6%Belgium Herstal 123,787 34,142 27.6%Belgium Houthalen 69,195 2,300 3.3%Belgium Oostende 65,000 15,000 23.1%Belgium Roeselare 56,000 11,000 19.6%Belgium Thurmaide 259,614 134,910 52.0%Czech Republic Brno 106,740 5 0.0%Czech Republic Liberec 92,260 4 0.0%Denmark Grenaa 20,975 6,166 29.4%Denmark Hadsund 20,092 4,845 24.1%Denmark Hjørring 61,270 26,338 43.0%Denmark Hobro 25,450 9,705 38.1%Denmark Hørsholm 109,493 28,835 26.3%Denmark Kolding 94,169 55,659 59.1%Denmark København 401,823 177,411 44.2%Denmark Middelfart 21,098 12,330 58.4%Denmark Nykøbing F 105,000 53,000 50.5%Denmark Næstved 89,458 40,316 45.1%Denmark Odense 268,498 109,740 40.9%Denmark Svendborg 54,000 23,500 43.5%Denmark Thisted 51,821 28,479 55.0%Denmark Aalborg 134,774 60,749 45.1%Denmark Århus 183,047 90,274 49.3%France Arrabloy 53,707 8,933 16.6%France Aurillac 6,840 140 2.0%France Cergy Pontoise 152,300 8,800 5.8%France Confort Meilars 18,809 477 2.5%France Coueron 98,954 35,882 36.3%Commercial/Industrial<strong>Waste</strong> as % of <strong>To</strong>talCombusted57
- Page 1 and 2:
SMALL SCALE WASTE-TO-ENERGY TECHNOL
- Page 3 and 4:
By assessing these small scale tech
- Page 5 and 6: LIST OF FIGURESFigure 1 Expanded Hi
- Page 7 and 8: 1 INTRODUCTION1.1 Current Status of
- Page 9 and 10: of plant capacity, technology, owne
- Page 11 and 12: Figure 2 Energos Gasifier and Therm
- Page 13 and 14: Table 2 Operating Energos Plants9,
- Page 15 and 16: 2.4 Ownership and Operation of Exis
- Page 17 and 18: 2.5 The Energos Plant at Forus, Nor
- Page 19 and 20: 3 NOVO ENERGYNovo Energy is a WTE c
- Page 21 and 22: Steam Customer: 3 M Manufacturing &
- Page 23 and 24: 5 MODULAR AND MICROSCALE SYSTEMSThe
- Page 25 and 26: Figure 10 below shows both co-curre
- Page 27 and 28: Heat Production: 4.7 MW Power: 350
- Page 29 and 30: Figure 14 Energy’s Mobile GEM 3T1
- Page 31 and 32: 6 SMALL SCALE PLANTS STATISTICAL AN
- Page 33 and 34: 33%8% 5% Large Scale Sludge23%Small
- Page 35 and 36: It was demonstrated in Figure 19 be
- Page 37 and 38: In Figure 21, the cumulative % of h
- Page 39 and 40: In Figure 23, the cumulative % of s
- Page 41 and 42: It can be seen below in Figure 25 t
- Page 43 and 44: REFERENCES1. Van Haaren R, Themelis
- Page 45 and 46: 34. Spliethoff H. “Power Generati
- Page 47 and 48: Table 10 Analysis of All Data Compi
- Page 49 and 50: ALL - Operational Data, 2004Country
- Page 51 and 52: ALL - Operational Data, 2004Country
- Page 53 and 54: ALL - Operational Data, 2004Country
- Page 55: Italy Modena 122,042 5,000 4.10%Nor
- Page 59 and 60: Italy Dalmine BG) 137,500 24,200 17
- Page 61 and 62: Analysis of the same data showed th
- Page 63 and 64: fuels) and landfill groundwater con
- Page 65: References1. John R. Zaller, The Na