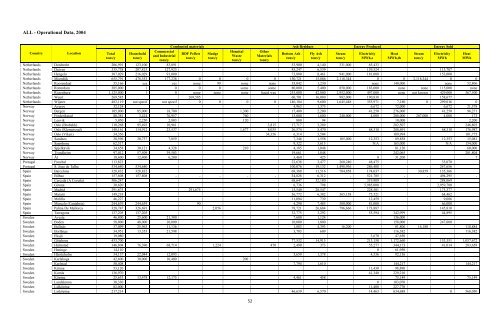
ALL - Operational Data, 2004CountryLocation<strong>To</strong>taltons/yHouseholdtons/yCombusted materials Ash Residues <strong>Energy</strong> Produced <strong>Energy</strong> SoldCommercialHospital OtherRDF Pellets SludgeBottom Ash Fly Ash Steam Electricity Heat Steam Electricityand Industrial<strong>Waste</strong> Materialstons/y tons/ytons/y tons/y tons/y MWh,e MWh,th tons/y MWhtons/ytons/y tons/yNetherlands Dordrecht 206,991 123,100 83,891 53,900 4,140 331,000 65,433Netherlands Duiven 335,738 207,815 127,923 85,247 6,539 159,524 113,707Netherlands Hengelo 307,029 216,029 91,000 73,800 8,461 941,000 181,000 153,000Netherlands Moerdijk 655,791 478,553 177,238 0 0 0 0 150,721 15,886 2,118,344 0 0 2,118,344 0 0Netherlands Roosendaal 55,166 yes yes none 99 none none 35,042 1,230 none 140,000 none 52,806Netherlands Rotterdam 385,000 1 0 0 0 some some 80,000 5,400 850,000 183,000 none none 115,000 noneNetherlands Rozenburg 1,125,000 1 0 none none none liquid was 253,000 42,000 2,952,000 497,000 none not known 429,000 567,500Netherlands Weurt 269,585 269,585 60,701 16,080 982,000 190,838 158,677Netherlands Wijster 483,119 not specif not specif 0 0 0 0 140,104 9,600 1,645,448 355,971 7,180 0 299,016 0Norway Averøy 32,124 4,963 1,375 6,672 72,000 6,672 21,578Norway Bergen 105,000 85,000 18,700 1,300 17,400 2,200 41,250 276,000 41,250 96,271Norway Frederikstad 80,381 3,424 76,957 760 15,000 1,600 240,000 4,000 208,000 207,000 4,000 173Norway Lenvik 5,050 2,250 2,803 120 880 94 10,000 2,200Norway Oslo (Brobekk) 110,268 95,492 10,961 3,815 17,717 3,289 282,507 246,803Norway Oslo (Klemetsrud) 148,161 114,912 23,537 1,677 8,035 26,574 5,470 68,318 288,691 68,318 176,987Norway Oslo (Viken) 34,356 34,356 6,314 3,504 109,994 101,775Norway Sandnes 38,596 30,737 7,859 7,346 1,558 105,000 12,353 89,858 12,353 15,081Norway Sarpsborg 62,517 9,322 3,615 N/A 165,000 N/A 154,000Norway Spjelkavik 34,658 30,121 4,328 210 4,185 1,048 81,120 60,000Norway Trondheim 97,012 57,509 39,503 19,661 1,848 242,065 201,804Norway Ål 18,600 12,400 6,200 3,460 425 0 31,200 7Portugal Funchal 113,823 22,638 3,477 260,240 48,475 35,070Portugal S. Joao de Talha 534,640 534,640 100,076 19,132 1,498,936 286,408 247,656Spain Barcelona 328,832 328,832 69,388 11,516 704,858 174,037 30,859 135,366Spain Bilbao 157,808 157,808 - - - - - 34,828 6,312 - 521,785 - - 494,295 -Spain Cerceda (A Coruña) 506,247 68,647 32,180 319,909 288,069Spain Girona 30,620 6,736 798 5,985,000 2,959,700Spain Madrid 291,675 291,675 15,540 28,547 228,501 173,377Spain Mataró 149,218 36,772 6,382 365,138 75,521 64,462Spain Melilla 46,227 11,094 739 12,459 9,086Spain Meruelo (Cantabria) 244,639 244,639 90 4,290 7,485 300,000 81,000 66,000Spain Palma De Mallorca 328,747 326,691 2,056 78,721 26,684 796,666 173,887 145,810Spain Tarragona 137,205 137,205 32,775 3,292 55,594 342,999 44,895Sweden Avesta 46,800 25,600 21,300 7,600 1,124 136,000Sweden Boden 58,000 48,000 10,000 10,000 1,000 158,000 247,000Sweden Bollnäs 37,099 25,963 11,136 1,883 4,393 16,200 81,806 16,180 118,884Sweden Borlänge 34,951 13,353 21,598 3,703 609 116,382 116,382Sweden Eksjö 19,080 3,670 47,650Sweden Göteborg 433,700 77,532 14,915 213,150 1,172,660 153,351 1,057,672Sweden Halmstad 146,804 76,396 68,714 1,224 470 2,490 373 55,277 344,173 41,014 283,658Sweden Haninge 14,110 0 61,950Sweden Hässleholm 34,137 22,044 12,093 5,659 1,378 4,536 92,136Sweden Karlskoga 42,600 30,000 10,400 200Sweden Karlstad 50,408 7,794 1,610 144,217 144,217Sweden Kiruna 53,120 11,430 98,890Sweden Kumla 136,970 41,340 229,210Sweden Köping 25,653 13,478 12,175 4,461 458 75,149 75,149Sweden Landskrona 30,330 0 103,070Sweden Lidköping 82,000 11,400 227,770Sweden Linköping 217,214 46,639 6,570 14,463 634,688 0 568,05052HeatMWh
ALL - Operational Data, 2004CountryLocation<strong>To</strong>taltons/yHouseholdtons/yCombusted materials Ash Residues <strong>Energy</strong> Produced <strong>Energy</strong> SoldCommercialHospital OtherRDF Pellets SludgeBottom Ash Fly Ash Steam Electricity Heat Steam Electricityand Industrial<strong>Waste</strong> Materialstons/y tons/ytons/y tons/y tons/y MWh,e MWh,th tons/y MWhtons/ytons/y tons/ySweden Malmö 385,879 202,206 156,160 1,700 25,813 82,680 15,996 137,677 1,030,136 107,516 996,962Sweden Mora 16,455 11,500 4,955 0 0 0 0 2,634 378 0 0 41,494 0 39,860Sweden Norrköping 163,700 98,535 59,091 14,920 13,805 57,717 352,319 40,252 349,197Sweden Stockholm 520,221 339,306 180,915 63,666 27,287 219,700 1,404,900Sweden Sundsvall 44,790 19,570 90,870Sweden Södertälje 249,211 113,538 135,673 12,000 25,000 75,000 938,086 75,000 1,810,451Sweden Umeå 188,074 30,181 6,810 64,658 470,189 30,886 457,590Sweden Västervik 46,600 0 116,220Switzerland Aire-la-ville 314,002 72,247 7,095 1,115,625 172,328 0 129,092 0Switzerland Basel 189,624 34,000 4,720 43,830 545,083 19,195 443,091Switzerland Bazenheid 75,233 17,000 2,300 35,600 350,000 27,000 25,000Switzerland Bern 109,300 21,500 2,150 413,700 30,400 198,000 12,400 191,100Switzerland Biel 40,993 8,788 1,419 164,825 20,208 14,789 15,507Switzerland Brig-Gils 27,434 n.a. n.a. n.a. n.a. n.a. n.a.Switzerland Buchs AG 119,500 23,100 2,670 47,600 61,500Switzerland Buchs SG 71,535 35,000 5,560 542,000 100,000 81,000 80,000Switzerland Colombier 60,513 17,000 2,531 198,367 31,668 26,530 21,985 20,771Switzerland Dietikon 81,180 20,000 2,500 n.a. 57,000 n.a. 0 43,000 18,000Switzerland Emmenbrücke 84,316 18,600 1,520 265,600 43,800 43,600 0 34,500 43,100Switzerland Horgen 59,242 n.a. n.a. 130,000 20,000 71,000 10,000 47,000Switzerland Kezo 163,132 35,000 7,000 680,000 100,000 308,000 70,000 20,000Switzerland La Chaux-de-Fonds 50,552 10,000 1,200 27,000 52,000Switzerland Lausanne 44,117 9,846 1,004 140,502 93,855 118,108 78,872Switzerland Lausanne 120,000 50-100% 0-40% 0-20% 0-10% 0-10% n.a. 24,600 2,400 548,000 n.a. n.a. 0 0 0Switzerland Monthey 98,805 20,800 4,960 n.a. 60,756 n.a. 0 45,000 0Switzerland Niederurnen 99,400 n.a. 1,000 190,000 64,000 0 50,000Switzerland Oftringen 68,362 18,000 1,900 200,000 54,000 160,000 0 41,000 0Switzerland Posieux 88,401 20,000 6,000 6,500 65,000 6,000 55,000Switzerland St. Gallen 75,362 19,000 2,200 34,200 55,000 24,300 55,000Switzerland Turgi 113,945 23,433 2,985 441,500 86,950 70,260 36,080Switzerland Untervaz 50,396 11,300 800 213,670 18,118 160,252 74,702 9,733 60,122Switzerland Uvrier 52,480 10,350 1,260 153,400 23,700 0 14,600Switzerland Weinfelden 113,097 13,885 n.a. 470,000 46,000 417,000 164,100 31,000 183,300Switzerland Winterthur 145,327 31,750 4,621 580,000 80,000 420,000 62,000 n.a.Switzerland Zuchwil 196,534 49,606 N.A. 727,168 656,625 40,807 233,816Switzerland Zürich 163,613 32,728 325,711Switzerland Zürich 148,452 56,993 107,002<strong>To</strong>tal331 Plants DataSubmitted49,806,932 17,535,833 3,710,588 1,398,260 128,874 97,458 445,400 10,731,176 1,110,334 76,044,919 21,784,843 32,977,144 7,410,179 17,415,866 30,542,238% of total combusted or MWh/ton 100.0% 35.2% 7.4% 2.8% 0.3% 0.2% 0.9% 21.5% 2.2% 1.53 0.44 0.66 0.15 0.35 0.61HeatMWh<strong>To</strong>tal tonsMSW, tonsCommercialand Industrial,tonsRDFPellets, tonsSludge,tonsHospital<strong>Waste</strong>, tonsOthermaterials, tonsBottom Ashtons/yFly ash,tons/ySteamproduced,tons/toncombustedElectricityproduced,MWh,e /toncombustedHeatproduced ,MWh,th,/toncombustedSteamsold/toncombustedElectricitysold, MWh/toncombustedHeat sold,MWh/toncombusted* It should be noted that only some WTE plants reported to ISWA materials that were co-combusted. Therefore, there could be other co-combusting WTE plants that are not included in the above table.53
- Page 1 and 2: SMALL SCALE WASTE-TO-ENERGY TECHNOL
- Page 3 and 4: By assessing these small scale tech
- Page 5 and 6: LIST OF FIGURESFigure 1 Expanded Hi
- Page 7 and 8: 1 INTRODUCTION1.1 Current Status of
- Page 9 and 10: of plant capacity, technology, owne
- Page 11 and 12: Figure 2 Energos Gasifier and Therm
- Page 13 and 14: Table 2 Operating Energos Plants9,
- Page 15 and 16: 2.4 Ownership and Operation of Exis
- Page 17 and 18: 2.5 The Energos Plant at Forus, Nor
- Page 19 and 20: 3 NOVO ENERGYNovo Energy is a WTE c
- Page 21 and 22: Steam Customer: 3 M Manufacturing &
- Page 23 and 24: 5 MODULAR AND MICROSCALE SYSTEMSThe
- Page 25 and 26: Figure 10 below shows both co-curre
- Page 27 and 28: Heat Production: 4.7 MW Power: 350
- Page 29 and 30: Figure 14 Energy’s Mobile GEM 3T1
- Page 31 and 32: 6 SMALL SCALE PLANTS STATISTICAL AN
- Page 33 and 34: 33%8% 5% Large Scale Sludge23%Small
- Page 35 and 36: It was demonstrated in Figure 19 be
- Page 37 and 38: In Figure 21, the cumulative % of h
- Page 39 and 40: In Figure 23, the cumulative % of s
- Page 41 and 42: It can be seen below in Figure 25 t
- Page 43 and 44: REFERENCES1. Van Haaren R, Themelis
- Page 45 and 46: 34. Spliethoff H. “Power Generati
- Page 47 and 48: Table 10 Analysis of All Data Compi
- Page 49 and 50: ALL - Operational Data, 2004Country
- Page 51: ALL - Operational Data, 2004Country
- Page 55 and 56: Italy Modena 122,042 5,000 4.10%Nor
- Page 57 and 58: Analysis of the same data showed th
- Page 59 and 60: Italy Dalmine BG) 137,500 24,200 17
- Page 61 and 62: Analysis of the same data showed th
- Page 63 and 64: fuels) and landfill groundwater con
- Page 65: References1. John R. Zaller, The Na