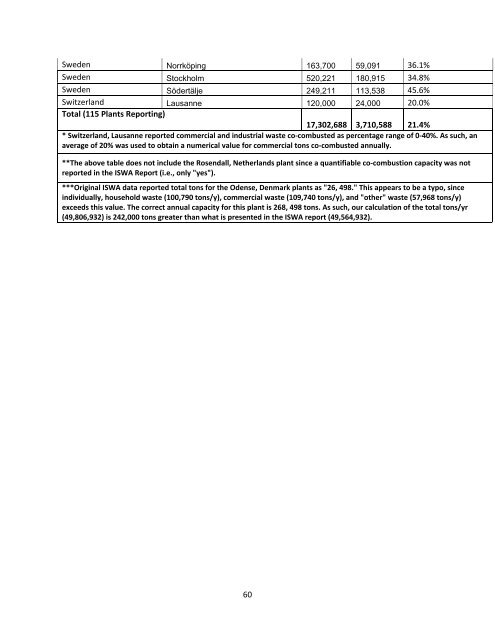
Sweden Norrköping 163,700 59,091 36.1%Sweden Stockholm 520,221 180,915 34.8%Sweden Södertälje 249,211 113,538 45.6%Switzerland Lausanne 120,000 24,000 20.0%<strong>To</strong>tal (115 Plants Reporting)17,302,688 3,710,588 21.4%* Switzerland, Lausanne reported commercial and industrial waste co‐combusted as percentage range of 0‐40%. As such, anaverage of 20% was used to obtain a numerical value for commercial tons co‐combusted annually.**The above table does not include the Rosendall, Netherlands plant since a quantifiable co‐combustion capacity was notreported in the ISWA Report (i.e., only "yes").***Original ISWA data reported total tons for the Odense, Denmark plants as "26, 498." This appears to be a typo, sinceindividually, household waste (100,790 tons/y), commercial waste (109,740 tons/y), and "other" waste (57,968 tons/y)exceeds this value. The correct annual capacity for this plant is 268, 498 tons. As such, our calculation of the total tons/yr(49,806,932) is 242,000 tons greater than what is presented in the ISWA report (49,564,932).60
Analysis of the same data showed that 10 plants reported co-combustion of RDF (Table 14). On theaverage, the RDF combusted by these plants amounted to 5.67% of the total feedstock.CountryTable 14 Co-Combustion of RDF in EuropeLocation<strong>To</strong>tal<strong>To</strong>ns/yRDF<strong>To</strong>ns/yRDF as %of <strong>To</strong>talCombustedAustria Zwentendorf 323,000 2,300 0.71%Denmark Næstved 89,458 63 0.07%France Douchy les Mines 39,295 3,530 8.98%Italy Poggibonsi (SI) 20,436 2,728 13.35%Italy Ravenna 169,954 44,601 26.24%Italy Trieste 138,200 1,000 0.72%Italy Vercelli 58,890 1,530 2.60%Italy Verona 131,300 7,800 5.94%SpainMeruelo(Cantabria) 244,639 90 0.04%Switzerland Lausanne 120,000 12,000 10.00%<strong>To</strong>tal (10 Plants Reporting)1,335,172 75,642 5.67%* Switzerland, Lausanne reported RDF co‐combusted as percentage range of 0‐20%. As such, anaverage of 10% was used to obtain a numerical value for RDF tons co‐combusted annually.**The following eleven ISWA plants are combusting RDF only and therefore were not includedin the above table as no co‐combustion is taking place: Bergamo, Italy (7 plants), San Vittore delLazio , Italy (1 plant), Trezzo sull, Italy (1 plant), Weurt, Netherlands (1 plant), and Madrid Spain(1 plant).***The Södertälje, Sweden plant is not co‐combusting RDF with MSW/household waste, onlycommercial waste and therefore was not included in the above table.****The Schio, Italy plant is not co‐combusting RDF with MSW/household waste, only hospitaland "other" waste and therefore was not included in the above table.It should be noted that only some WTE plants reported to ISWA materials that were co-combusted.Therefore, there could be other co-combusting WTE plants that are not included in Tables 10-14.61
- Page 1 and 2:
SMALL SCALE WASTE-TO-ENERGY TECHNOL
- Page 3 and 4:
By assessing these small scale tech
- Page 5 and 6:
LIST OF FIGURESFigure 1 Expanded Hi
- Page 7 and 8:
1 INTRODUCTION1.1 Current Status of
- Page 9 and 10: of plant capacity, technology, owne
- Page 11 and 12: Figure 2 Energos Gasifier and Therm
- Page 13 and 14: Table 2 Operating Energos Plants9,
- Page 15 and 16: 2.4 Ownership and Operation of Exis
- Page 17 and 18: 2.5 The Energos Plant at Forus, Nor
- Page 19 and 20: 3 NOVO ENERGYNovo Energy is a WTE c
- Page 21 and 22: Steam Customer: 3 M Manufacturing &
- Page 23 and 24: 5 MODULAR AND MICROSCALE SYSTEMSThe
- Page 25 and 26: Figure 10 below shows both co-curre
- Page 27 and 28: Heat Production: 4.7 MW Power: 350
- Page 29 and 30: Figure 14 Energy’s Mobile GEM 3T1
- Page 31 and 32: 6 SMALL SCALE PLANTS STATISTICAL AN
- Page 33 and 34: 33%8% 5% Large Scale Sludge23%Small
- Page 35 and 36: It was demonstrated in Figure 19 be
- Page 37 and 38: In Figure 21, the cumulative % of h
- Page 39 and 40: In Figure 23, the cumulative % of s
- Page 41 and 42: It can be seen below in Figure 25 t
- Page 43 and 44: REFERENCES1. Van Haaren R, Themelis
- Page 45 and 46: 34. Spliethoff H. “Power Generati
- Page 47 and 48: Table 10 Analysis of All Data Compi
- Page 49 and 50: ALL - Operational Data, 2004Country
- Page 51 and 52: ALL - Operational Data, 2004Country
- Page 53 and 54: ALL - Operational Data, 2004Country
- Page 55 and 56: Italy Modena 122,042 5,000 4.10%Nor
- Page 57 and 58: Analysis of the same data showed th
- Page 59: Italy Dalmine BG) 137,500 24,200 17
- Page 63 and 64: fuels) and landfill groundwater con
- Page 65: References1. John R. Zaller, The Na