Resolution Enhancement by Vibrating Displays - Floraine Berthouzoz
Resolution Enhancement by Vibrating Displays - Floraine Berthouzoz
Resolution Enhancement by Vibrating Displays - Floraine Berthouzoz

You also want an ePaper? Increase the reach of your titles
YUMPU automatically turns print PDFs into web optimized ePapers that Google loves.
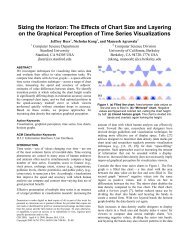
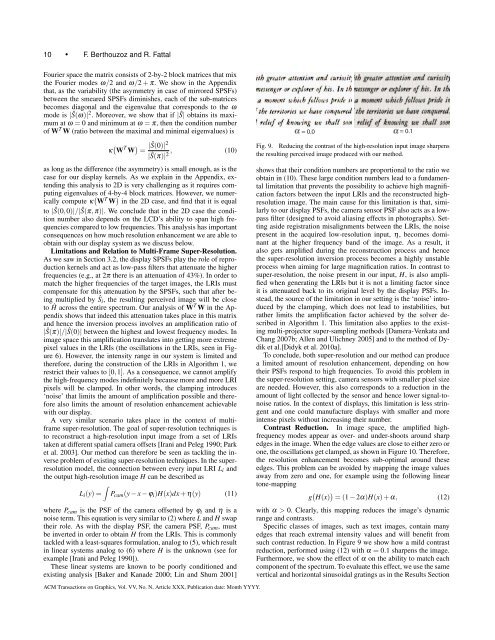
10 • F. <strong>Berthouzoz</strong> and R. FattalFourier space the matrix consists of 2-<strong>by</strong>-2 block matrices that mixthe Fourier modes ω/2 and ω/2 + π. We show in the Appendixthat, as the variability (the asymmetry in case of mirrored SPSFs)between the smeared SPSFs diminishes, each of the sub-matricesbecomes diagonal and the eigenvalue that corresponds to the ωmode is |Ŝ(ω)| 2 . Moreover, we show that if |Ŝ| obtains its maximumat ω = 0 and minimum at ω = π, then the condition numberof W T W (ratio between the maximal and minimal eigenvalues) isκ ( W T W ) = |Ŝ(0)|2|Ŝ(π)| 2 , (10)as long as the difference (the asymmetry) is small enough, as is thecase for our display kernels. As we explain in the Appendix, extendingthis analysis to 2D is very challenging as it requires computingeigenvalues of 4-<strong>by</strong>-4 block matrices. However, we numericallycompute κ ( W T W ) in the 2D case, and find that it is equalto |Ŝ(0,0)|/|Ŝ(π,π)|. We conclude that in the 2D case the conditionnumber also depends on the LCD’s ability to span high frequenciescompared to low frequencies. This analysis has importantconsequences on how much resolution enhancement we are able toobtain with our display system as we discuss below.Limitations and Relation to Multi-Frame Super-<strong>Resolution</strong>.As we saw in Section 3.2, the display SPSFs play the role of reproductionkernels and act as low-pass filters that attenuate the higherfrequencies (e.g., at 2π there is an attenuation of 43%). In order tomatch the higher frequencies of the target images, the LRIs mustcompensate for this attenuation <strong>by</strong> the SPSFs, such that after beingmultiplied <strong>by</strong> Ŝ i , the resulting perceived image will be closeto Ĥ across the entire spectrum. Our analysis of W T W in the Appendixshows that indeed this attenuation takes place in this matrixand hence the inversion process involves an amplification ratio of|Ŝ(π)|/|Ŝ(0)| between the highest and lowest frequency modes. Inimage space this amplification translates into getting more extremepixel values in the LRIs (the oscillations in the LRIs, seen in Figure6). However, the intensity range in our system is limited andtherefore, during the construction of the LRIs in Algorithm 1, werestrict their values to [0,1]. As a consequence, we cannot amplifythe high-frequency modes indefinitely because more and more LRIpixels will be clamped. In other words, the clamping introduces‘noise’ that limits the amount of amplification possible and thereforealso limits the amount of resolution enhancement achievablewith our display.A very similar scenario takes place in the context of multiframesuper-resolution. The goal of super-resolution techniques isto reconstruct a high-resolution input image from a set of LRIstaken at different spatial camera offsets [Irani and Peleg 1990; Parket al. 2003]. Our method can therefore be seen as tackling the inverseproblem of existing super-resolution techniques. In the superresolutionmodel, the connection between every input LRI L i andthe output high-resolution image H can be described as∫L i (y) = P cam (y − x − ϕ i )H(x)dx + η(y) (11)where P cam is the PSF of the camera offsetted <strong>by</strong> ϕ i and η is anoise term. This equation is very similar to (2) where L and H swaptheir role. As with the display PSF, the camera PSF, P cam , mustbe inverted in order to obtain H from the LRIs. This is commonlytackled with a least-squares formulation, analog to (5), which resultin linear systems analog to (6) where H is the unknown (see forexample [Irani and Peleg 1990]).These linear systems are known to be poorly conditioned andexisting analysis [Baker and Kanade 2000; Lin and Shum 2001]= 0.0 = 0.1Fig. 9. Reducing the contrast of the high-resolution input image sharpensthe resulting perceived image produced with our method.shows that their condition numbers are proportional to the ratio weobtain in (10). These large condition numbers lead to a fundamentallimitation that prevents the possibility to achieve high magnificationfactors between the input LRIs and the reconstructed highresolutionimage. The main cause for this limitation is that, similarlyto our display PSFs, the camera sensor PSF also acts as a lowpassfilter (designed to avoid aliasing effects in photographs). Settingaside registration misalignments between the LRIs, the noisepresent in the acquired low-resolution input, η, becomes dominantat the higher frequency band of the image. As a result, italso gets amplified during the reconstruction process and hencethe super-resolution inversion process becomes a highly unstableprocess when aiming for large magnification ratios. In contrast tosuper-resolution, the noise present in our input, H, is also amplifiedwhen generating the LRIs but it is not a limiting factor sinceit is attenuated back to its original level <strong>by</strong> the display PSFs. Instead,the source of the limitation in our setting is the ‘noise’ introduced<strong>by</strong> the clamping, which does not lead to instabilities, butrather limits the amplification factor achieved <strong>by</strong> the solver describedin Algorithm 1. This limitation also applies to the existingmulti-projector super-sampling methods [Damera-Venkata andChang 2007b; Allen and Ulichney 2005] and to the method of Dydiket al.[Didyk et al. 2010a].To conclude, both super-resolution and our method can producea limited amount of resolution enhancement, depending on howtheir PSFs respond to high frequencies. To avoid this problem inthe super-resolution setting, camera sensors with smaller pixel sizeare needed. However, this also corresponds to a reduction in theamount of light collected <strong>by</strong> the sensor and hence lower signal-tonoiseratios. In the context of displays, this limitation is less stringentand one could manufacture displays with smaller and moreintense pixels without increasing their number.Contrast Reduction. In image space, the amplified highfrequencymodes appear as over- and under-shoots around sharpedges in the image. When the edge values are close to either zero orone, the oscillations get clamped, as shown in Figure 10. Therefore,the resolution enhancement becomes sub-optimal around theseedges. This problem can be avoided <strong>by</strong> mapping the image valuesaway from zero and one, for example using the following lineartone-mappingg ( H(x) ) = (1 − 2α)H(x) + α, (12)with α > 0. Clearly, this mapping reduces the image’s dynamicrange and contrasts.Specific classes of images, such as text images, contain manyedges that reach extremal intensity values and will benefit fromsuch contrast reduction. In Figure 9 we show how a mild contrastreduction, performed using (12) with α = 0.1 sharpens the image.Furthermore, we show the effect of α on the ability to match eachcomponent of the spectrum. To evaluate this effect, we use the samevertical and horizontal sinusoidal gratings as in the Results SectionACM Transactions on Graphics, Vol. VV, No. N, Article XXX, Publication date: Month YYYY.