Resolution Enhancement by Vibrating Displays - Floraine Berthouzoz
Resolution Enhancement by Vibrating Displays - Floraine Berthouzoz
Resolution Enhancement by Vibrating Displays - Floraine Berthouzoz

Create successful ePaper yourself
Turn your PDF publications into a flip-book with our unique Google optimized e-Paper software.
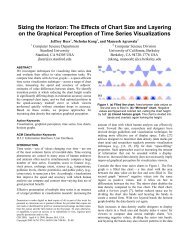
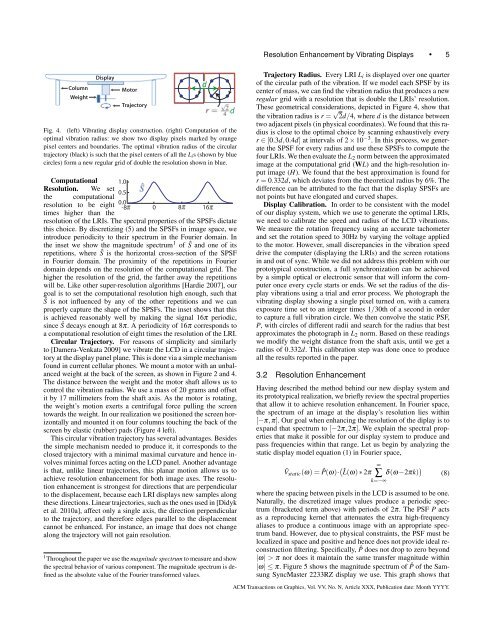
<strong>Resolution</strong> <strong>Enhancement</strong> <strong>by</strong> <strong>Vibrating</strong> <strong>Displays</strong> • 5ColumnWeightDisplayMotorTrajectoryFig. 4. (left) <strong>Vibrating</strong> display construction. (right) Computation of theoptimal vibration radius: we show two display pixels marked <strong>by</strong> orangepixel centers and boundaries. The optimal vibration radius of the circulartrajectory (black) is such that the pixel centers of all the L i s (shown <strong>by</strong> bluecircles) form a new regular grid of double the resolution shown in blue.Computational<strong>Resolution</strong>. We setthe computationalresolution to be eighttimes higher than the1.00.50.0-8 0 8 16resolution of the LRIs. The spectral properties of the SPSFs dictatethis choice. By discretizing (5) and the SPSFs in image space, weintroduce periodicity to their spectrum in the Fourier domain. Inthe inset we show the magnitude spectrum 1 of Ŝ and one of itsrepetitions, where Ŝ is the horizontal cross-section of the SPSFin Fourier domain. The proximity of the repetitions in Fourierdomain depends on the resolution of the computational grid. Thehigher the resolution of the grid, the farther away the repetitionswill be. Like other super-resolution algorithms [Hardie 2007], ourgoal is to set the computational resolution high enough, such thatŜ is not influenced <strong>by</strong> any of the other repetitions and we canproperly capture the shape of the SPSFs. The inset shows that thisis achieved reasonably well <strong>by</strong> making the signal 16π periodic,since Ŝ decays enough at 8π. A periodicity of 16π corresponds toa computational resolution of eight times the resolution of the LRI.Circular Trajectory. For reasons of simplicity and similarlyto [Damera-Venkata 2009] we vibrate the LCD in a circular trajectoryat the display panel plane. This is done via a simple mechanismfound in current cellular phones. We mount a motor with an unbalancedweight at the back of the screen, as shown in Figure 2 and 4.The distance between the weight and the motor shaft allows us tocontrol the vibration radius. We use a mass of 20 grams and offsetit <strong>by</strong> 17 millimeters from the shaft axis. As the motor is rotating,the weight’s motion exerts a centrifugal force pulling the screentowards the weight. In our realization we positioned the screen horizontallyand mounted it on four columns touching the back of thescreen <strong>by</strong> elastic (rubber) pads (Figure 4 left).This circular vibration trajectory has several advantages. Besidesthe simple mechanism needed to produce it, it corresponds to theclosed trajectory with a minimal maximal curvature and hence involvesminimal forces acting on the LCD panel. Another advantageis that, unlike linear trajectories, this planar motion allows us toachieve resolution enhancement for both image axes. The resolutionenhancement is strongest for directions that are perpendicularto the displacement, because each LRI displays new samples alongthese directions. Linear trajectories, such as the ones used in [Didyket al. 2010a], affect only a single axis, the direction perpendicularto the trajectory, and therefore edges parallel to the displacementcannot be enhanced. For instance, an image that does not changealong the trajectory will not gain resolution.1 Throughout the paper we use the magnitude spectrum to measure and showthe spectral behavior of various component. The magnitude spectrum is definedas the absolute value of the Fourier transformed values.ddTrajectory Radius. Every LRI L i is displayed over one quarterof the circular path of the vibration. If we model each SPSF <strong>by</strong> itscenter of mass, we can find the vibration radius that produces a newregular grid with a resolution that is double the LRIs’ resolution.These geometrical considerations, depicted in Figure 4, show thatthe vibration radius is r = √ 2d/4, where d is the distance betweentwo adjacent pixels (in physical coordinates). We found that this radiusis close to the optimal choice <strong>by</strong> scanning exhaustively everyr ∈ [0.3d,0.4d] at intervals of 2 × 10 −3 . In this process, we generatethe SPSF for every radius and use these SPSFs to compute thefour LRIs. We then evaluate the L 2 norm between the approximatedimage at the computational grid (WL) and the high-resolution inputimage (H). We found that the best approximation is found forr = 0.332d, which deviates from the theoretical radius <strong>by</strong> 6%. Thedifference can be attributed to the fact that the display SPSFs arenot points but have elongated and curved shapes.Display Calibration. In order to be consistent with the modelof our display system, which we use to generate the optimal LRIs,we need to calibrate the speed and radius of the LCD vibrations.We measure the rotation frequency using an accurate tachometerand set the rotation speed to 30Hz <strong>by</strong> varying the voltage appliedto the motor. However, small discrepancies in the vibration speeddrive the computer (displaying the LRIs) and the screen rotationsin and out of sync. While we did not address this problem with ourprototypical construction, a full synchronization can be achieved<strong>by</strong> a simple optical or electronic sensor that will inform the computeronce every cycle starts or ends. We set the radius of the displayvibrations using a trial and error process. We photograph thevibrating display showing a single pixel turned on, with a cameraexposure time set to an integer times 1/30th of a second in orderto capture a full vibration circle. We then convolve the static PSF,P, with circles of different radii and search for the radius that bestapproximates the photograph in L 2 norm. Based on these readingswe modify the weight distance from the shaft axis, until we get aradius of 0.332d. This calibration step was done once to produceall the results reported in the paper.3.2 <strong>Resolution</strong> <strong>Enhancement</strong>Having described the method behind our new display system andits prototypical realization, we briefly review the spectral propertiesthat allow it to achieve resolution enhancement. In Fourier space,the spectrum of an image at the display’s resolution lies within[−π,π]. Our goal when enhancing the resolution of the diplay is toexpand that spectrum to [−2π,2π]. We explain the spectral propertiesthat make it possible for our display system to produce andpass frequencies within that range. Let us begin <strong>by</strong> analyzing thestatic display model equation (1) in Fourier space,∞ˆV static (ω) = ˆP(ω)·(ˆL(ω) ∗ 2π ∑ δ(ω−2πk) ) (8)k=−∞where the spacing between pixels in the LCD is assumed to be one.Naturally, the discretized image values produce a periodic spectrum(bracketed term above) with periods of 2π. The PSF P actsas a reproducing kernel that attenuates the extra high-frequencyaliases to produce a continuous image with an appropriate spectrumband. However, due to physical constraints, the PSF must belocalized in space and positive and hence does not provide ideal reconstructionfiltering. Specifically, ˆP does not drop to zero beyond|ω| > π nor does it maintain the same transfer magnitude within|ω| ≤ π. Figure 5 shows the magnitude spectrum of ˆP of the SamsungSyncMaster 2233RZ display we use. This graph shows thatACM Transactions on Graphics, Vol. VV, No. N, Article XXX, Publication date: Month YYYY.