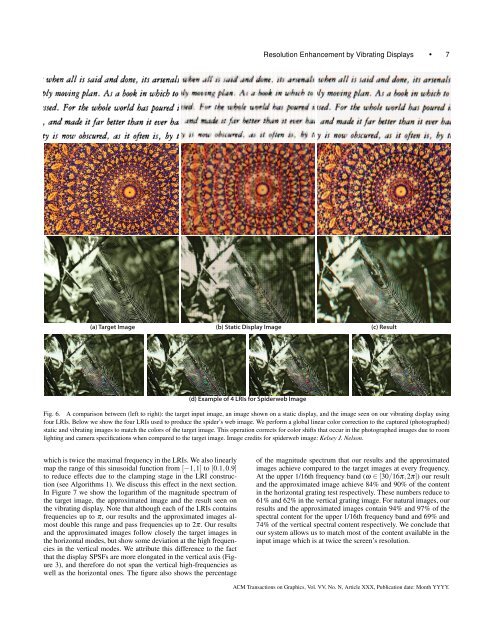
6 • F. <strong>Berthouzoz</strong> and R. Fattal1.00.5Static Display0.891.00.5<strong>Vibrating</strong> Display0.571.00.5Static Display1.00.5<strong>Vibrating</strong> Display0.0-8 -4 - 0 4 80.0-8 -4 -2 0 2 4 80.0-8 -4 -2 0 2 4 80.0-8 -4 -2 0 2 4 8Fig. 5. The magnitude spectrum of the horizontal cross-sections of the display PSF ( ˆP) and SPSF (Ŝ). (left) The dashed red lines show the extents of oneperiod and mark the highest frequency the static or vibrating display can pass. (right) Grid effects when displaying a constant image on the static and vibratingdisplays. The Fourier transform of a discrete constant image are periodic delta spikes. In the static configuration, the first and strongest repetition of the deltaspike appears at ±2π, whereas in the vibrating case it appears in ±4π where it is considerably lower as it is attenuated <strong>by</strong> |Ŝ(±4π)|.for the horizontal ω = (π,0) mode, which is the highest horizontalfrequency available in L, the magnitude spectrum of ˆP at π reduces<strong>by</strong> 11% compared to | ˆP(0)|. Clearly, these design choices attemptto balance between the ability to maintain the same brightness levelwhen displaying content at different frequencies and filtering-outspurious high frequencies.In our construction we exploit the fact that the PSF | ˆP| and theSPSFs |Ŝ i | decay slowly and do not completely eliminate frequenciesbeyond π. Figure 5 shows |Ŝ i | which appears slightly narrowerdue to the smoothing S i undergoes when being smeared in space.Nevertheles, |Ŝ i | still manages to pass 57% of the content at the2π horizontal mode which corresponds to double the highest frequencyin L and is the highest frequency we target with our construction.The ability to display frequencies beyond π and up to 2πrequires the system to generate spectrum with periods ≥ 4π. Thisis what we achieve <strong>by</strong> vibrating the display and can be easily verified<strong>by</strong> considering the Fourier transformation of Equation (3) thatmodels our system. For simplicity we do this in one dimension withn = 2 and getˆV vibrating (ω) =n∑i=1∞Ŝ i (ω)·(ˆL i (ω) ∗ 2π ∑ δ(ω−2πk)e − jϕ i·ω ) ,k=−∞(9)where the factor e − jϕ i·ω results from the spatial offset betweenthe SPSFs of different LRIs. Assuming these centers form a uniformgrid <strong>by</strong> setting the vibration radius r = √ 2d/4 then, as shownabove, this yields effective pixel spacing which is half the originaland hence ϕ 1 = 0 and ϕ 2 = 1/2. Therefore, the e − jϕ i·ω factor in (9)becomes (−1) k for i = 2 and thus the discretized signal produced<strong>by</strong> L1 and L 2 generates a 4π periodic spectrum.To conclude, we achieve resolution enhancement <strong>by</strong> mimicking adenser pixel layout <strong>by</strong> offsetting the display and benefit the spectralproperties of the display PSFs that transfer the added resolution.4. RESULTSTo evaluate our construction, we run our method on a set of 27 highresolutioninput images. Figure 6 shows three example results of atext image and two natural images. Please view our supplementalwebsite for additional results. The figure shows: (a) the targetimage, (b) a single image of the same resolution as one of the lowresolutionimages displayed on a static display, and (c) the resultingimage we get <strong>by</strong> displaying our four LRIs on the vibrating display.The static image (b) is a reference to the image the display’s nativeresolution can produce. It has the number of pixels of a single LRIand it is computed <strong>by</strong> filtering and subsampling the target image.This operation is the most common approach used when trying todisplay an image that has a greater resolution than the display resolutionand corresponds to bicubic downsampling in image manipulationsoftware such as Adobe Photoshop. We captured both thestatic image (b) and the vibrating image (c) that a user would perceivewhen viewing our display <strong>by</strong> photographing the LCD panelat an exposure time equal to an integer times 1/30th of a second.Figure 6 also shows the four LRIs used for displaying the spider’sweb image. The results on the vibrating LCD show most of the finedetail that exists in the target image. This level of detail is missingin the images displayed on the static LCD. For example, both thetext letters and the spider’s web threads are much better resolved inthe vibrating display.In addition to resolution enhancement, the appearance of an underlyinggrid is greatly reduced in the vibrating display comparedto the static configuration. This is mostly apparent in flat regionsand it can be formally explained when displaying a constant image.This case corresponds to plugging a delta spike as the LRIs,ˆL(ω) = ˆL i (ω) = δ(ω) in equations (8) and (9) that model, inFourier space, the perceived images in the static and vibrating displayrespectively. As we explained earlier, the spectrum of the discreteimage values will contain the delta spike at periods of 2πin the static setting and at periods of 4π in the vibrating case, asshown in Figure 5 (right). Therefore, in the static case there will bea strong peak at |ω| = 2π, because the delta spike is multiplied <strong>by</strong>a large value | ˆP(±2π)| = 0.68. These strong repetitions of the deltaspike cause aliaising that is perceived as an underlying grid in theimage. In contrast, in the vibrating display the first repetitions ofthe delta spike appear at |ω| = 4π <strong>by</strong> which time it is attenuated <strong>by</strong>|Ŝ(±4π)| = 0.15. Thus, the grid effect is significantly reduced.Flickering occurs when displaying the LRIs at an insufficientrate. In our experience, when displaying n=4 LRIs at 30Hz we didnot perceive any flickering for natural images. But when viewingimages with very high-contrast edges such as text images or frequencymodes (sinusoidal gratings in Figure 7), we observed flickeringcomparable to the one in PAL or NTSC displays. As mentionedin Section 3.1 using fewer LRIs, or existing post-processingmethods for such display systems [Didyk et al. 2010a] would reducethe flickering, but might also undermine the amount of resolutionenhancement.4.1 Quantitative EvaluationIn order to better quantify the amount of resolution enhancementobtained, we compare the spectral content of the resulting perceivedimages to that of the input target images. In this evaluationwe also compare to the approximated image (WL) to evaluatethe precision of our construction and calibration steps. This testis performed on two types of images: (a) vertical and horizontalsinusoidal grating images of increasing frequency, and (b) an imagecomposed of four natural images, all shown in Figure 7. Thesinusoidal function we use is sin(cx 2 ) where x ∈ [0,π]. The highestfrequency of the sinusoidal gratings is controlled <strong>by</strong> c and weset it to be the highest frequency available in the target resolution,ACM Transactions on Graphics, Vol. VV, No. N, Article XXX, Publication date: Month YYYY.
<strong>Resolution</strong> <strong>Enhancement</strong> <strong>by</strong> <strong>Vibrating</strong> <strong>Displays</strong> • 7(a) Target Image (b) Static Display Image (c) Result(d) Example of 4 LRIs for Spiderweb ImageFig. 6. A comparison between (left to right): the target input image, an image shown on a static display, and the image seen on our vibrating display usingfour LRIs. Below we show the four LRIs used to produce the spider’s web image. We perform a global linear color correction to the captured (photographed)static and vibrating images to match the colors of the target image. This operation corrects for color shifts that occur in the photographed images due to roomlighting and camera specifications when compared to the target image. Image credits for spiderweb image: Kelsey J. Nelson.which is twice the maximal frequency in the LRIs. We also linearlymap the range of this sinusoidal function from [−1,1] to [0.1,0.9]to reduce effects due to the clamping stage in the LRI construction(see Algorithms 1). We discuss this effect in the next section.In Figure 7 we show the logarithm of the magnitude spectrum ofthe target image, the approximated image and the result seen onthe vibrating display. Note that although each of the LRIs containsfrequencies up to π, our results and the approximated images almostdouble this range and pass frequencies up to 2π. Our resultsand the approximated images follow closely the target images inthe horizontal modes, but show some deviation at the high frequenciesin the vertical modes. We attribute this difference to the factthat the display SPSFs are more elongated in the vertical axis (Figure3), and therefore do not span the vertical high-frequencies aswell as the horizontal ones. The figure also shows the percentageof the magnitude spectrum that our results and the approximatedimages achieve compared to the target images at every frequency.At the upper 1/16th frequency band (ω ∈ [30/16π,2π]) our resultand the approximated image achieve 84% and 90% of the contentin the horizontal grating test respectively. These numbers reduce to61% and 62% in the vertical grating image. For natural images, ourresults and the approximated images contain 94% and 97% of thespectral content for the upper 1/16th frequency band and 69% and74% of the vertical spectral content respectively. We conclude thatour system allows us to match most of the content available in theinput image which is at twice the screen’s resolution.ACM Transactions on Graphics, Vol. VV, No. N, Article XXX, Publication date: Month YYYY.