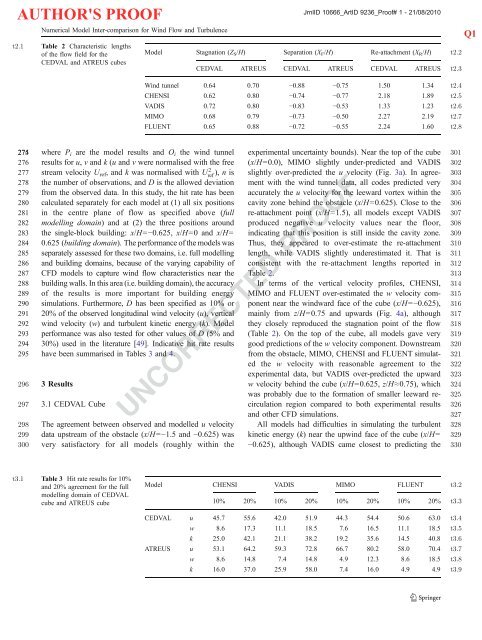
AUTHOR'S PROOFNumerical Model Inter-comparison for Wind Flow and Turbulencet2.1 Table 2 Characteristic lengthsof the flow field for theCEDVAL and ATREUS cubesJrnlID 10666_ArtID 9236_Proof# 1 - 21/08/2010Model Stagnation (Z S /H) Separation (X F /H) Re-attachment (X R /H)CEDVAL ATREUS CEDVAL ATREUS CEDVAL ATREUSWind tunnel 0.64 0.70 −0.88 −0.75 1.50 1.34CHENSI 0.62 0.80 −0.74 −0.77 2.18 1.89VADIS 0.72 0.80 −0.83 −0.53 1.33 1.23MIMO 0.68 0.79 −0.73 −0.50 2.27 2.19FLUENT 0.65 0.88 −0.72 −0.55 2.24 1.60t2.2t2.3t2.4t2.5t2.6t2.7t2.8Q1274 275 where P i are the model results and O i the wind tunnel276 results for u, v and k (u and v were normalised with the free277 stream velocity U ref , and k was normalised with Uref 2 ), n is278 the number of observations, and D is the allowed deviation279 from the observed data. In this study, the hit rate has been280 calculated separately for each model at (1) all six positions281 in the centre plane of flow as specified above (full282 modelling domain) and at (2) the three positions around283 the single-block building: x/H=−0.625, x/H=0 and x/H=284 0.625 (building domain). The performance of the models was285 separately assessed for these two domains, i.e. full modelling286 and building domains, because of the varying capability of287 CFD models to capture wind flow characteristics near the288 building walls. In this area (i.e. building domain), the accuracy289 of the results is more important for building energy290 simulations. Furthermore, D has been specified as 10% or291 20% of the observed longitudinal wind velocity (u), vertical292 wind velocity (w) and turbulent kinetic energy (k). Model293 performance was also tested for other values of D (5% and294 30%) used in the literature [49]. Indicative hit rate results295 have been summarised in Tables 3 and 4.296 3 Results297 3.1 CEDVAL Cube298 The agreement between observed and modelled u velocity299 data upstream of the obstacle (x/H=−1.5 and −0.625) was300 very satisfactory for all models (roughly within theexperimental uncertainty bounds). Near the top of the cube(x/H=0.0), MIMO slightly under-predicted and VADISslightly over-predicted the u velocity (Fig. 3a). In agreementwith the wind tunnel data, all codes predicted veryaccurately the u velocity for the leeward vortex within thecavity zone behind the obstacle (x/H=0.625). Close to there-attachment point (x/H=1.5), all models except VADISproduced negative u velocity values near the floor,indicating that this position is still inside the cavity zone.Thus, they appeared to over-estimate the re-attachmentlength, while VADIS slightly underestimated it. That isconsistent with the re-attachment lengths reported inTable 2.In terms of the vertical velocity profiles, CHENSI,MIMO and FLUENT over-estimated the w velocity componentnear the windward face of the cube (x/H=−0.625),mainly from z/H=0.75 and upwards (Fig. 4a), althoughthey closely reproduced the stagnation point of the flow(Table 2). On the top of the cube, all models gave verygood predictions of the w velocity component. Downstreamfrom the obstacle, MIMO, CHENSI and FLUENT simulatedthe w velocity with reasonable agreement to theexperimental data, but VADIS over-predicted the upwardw velocity behind the cube (x/H=0.625, z/H≈0.75), whichwas probably due to the formation of smaller leeward recirculationregion compared to both experimental resultsand other CFD simulations.All models had difficulties in simulating the turbulentkinetic energy (k) near the upwind face of the cube (x/H=−0.625), although VADIS came closest to predicting theUNCORRECTED PROOF301302303304305306307308309310311312313314315316317318319320321322323324325326327328329330t3.1 Table 3 Hit rate results for 10%and 20% agreement for the fullmodelling domain of CEDVALcube and ATREUS cubeModel CHENSI VADIS MIMO FLUENT10% 20% 10% 20% 10% 20% 10% 20%CEDVAL u 45.7 55.6 42.0 51.9 44.3 54.4 50.6 63.0w 8.6 17.3 11.1 18.5 7.6 16.5 11.1 18.5k 25.0 42.1 21.1 38.2 19.2 35.6 14.5 40.8ATREUS u 53.1 64.2 59.3 72.8 66.7 80.2 58.0 70.4w 8.6 14.8 7.4 14.8 4.9 12.3 8.6 18.5k 16.0 37.0 25.9 58.0 7.4 16.0 4.9 4.9t3.2t3.3t3.4t3.5t3.6t3.7t3.8t3.9
AUTHOR'S PROOFJrnlID 10666_ArtID 9236_Proof# 1 - 21/08/2010S. Vardoulakis et al.331 wind tunnel data. However, it is clear that all four models332 greatly over-estimated k in the impingement region near the333 upwind cube wall (Fig. 5a), which is a common problem334 with the standard k-ε turbulence model using the isotropic335 eddy viscosity concept [21, 50]. On the top of the cube,336 model results presented relatively large spread, with337 FLUENT giving the best agreement with the experimental338 data. Further downstream, the agreement was good, except339 that VADIS over-predicted k near the leeward face of the340 cube (x/H=0.625), while the other three models produced341 satisfactory results in this region of the flow (Fig. 5a).342 The hit rate results for the CEDVAL cube indicated that343 the longitudinal velocity (u) was predicted more accurately344 by FLUENT, the vertical velocity (w) by VADIS and the345 turbulent kinetic energy (k) by CHENSI in the full346 modelling domain, but by FLUENT closer to the building347 block (Tables 3 and 4). Overall, FLUENT appeared to348 simulate slightly more accurately the wind and turbulence349 field around the CEDVAL cube.350 3.2 ATREUS Cube351 CHENSI, MIMO and FLUENT produced very similar results352 for the profiles of the wind flow components at all353 measurement positions (Figs. 3b and 4b). In terms of the354 longitudinal velocity u shown in the vertical profiles, the355 agreement between models and experiment was excellent356 upstream (x/H=−1.5 and −0.625), with small discrepancies357 on the top of the cube (x/H=0.0) and downstream near the358 floor (x/H=1.5 and 2.5) (Fig. 3b). Again, VADIS slightly359 under-predicted the re-attachment length, while the other360 three models over-predicted it to different extents (Table 2).361 MIMO appeared to produce the larger re-circulation regions,362 while VADIS produced the smallest ones in both case363 studies. Near the vertical cube walls (x/H = ±0.625), all364 models agreed excellently with each other and with the u365 velocity measurements from the wind tunnel.366 Interestingly, all four models under-predicted the vertical367 velocity component near the top of the upwind wall of368 ATREUS cube (x/H=−0.625) (Fig. 4b), which is the opposite369 of what was observed in the case of CEDVAL cube (Fig. 4a).Fig. 3 Comparison of experimental and modelled longitudinalvelocity (u) profiles normalised with the free stream velocity for thea CEDVAL cube (top) and b ATREUS cube (bottom). Uncertaintybounds indicated for the experimental dataThis is probably due to the larger wall roughness and weakerlocal flow which generated less turbulent kinetic energy inthe impingement region of ATREUS cube in the numericalsimulations. These results are also consistent with the higherupwind stagnation points observed for ATREUS cubecompared to CEDVAL cube (Table 2). The profiles of thew velocity on the top and leeward side of ATREUS cubewere very similar to the CEDVAL cube patterns, althoughthe leeward re-circulation zone of ATREUS was smaller anda better agreement between model simulations and experimentaldata was achieved further downstream (x/H=2.5).CHENSI, MIMO and FLUENT produced very similarturbulent kinetic energy (k) profiles for both cubes (Fig. 5a,b), although the hit rates of MIMO and FLUENT wereimproved for the CEDVAL cube (Tables 3 and 4). Theturbulent kinetic energy (k) results produced by VADIS forthe ATREUS cube were clearly improved in comparisonwith the CEDVAL cube results (Fig. 5a, b), showing abetter match with the experimental data near the walls,probably due to the lower turbulent kinetic energyproduction in the impingement region of the flow.The hit rate results for the ATREUS cube indicate thatthe longitudinal velocity (u) was predicted more accuratelyby MIMO, the vertical velocity (w) by FLUENT and theturbulent kinetic energy (k) by VADIS (Tables 3 and 4).Although there was no clear difference in performancebetween the four models, MIMO seemed to simulateslightly more accurately the wind field and VADIS theturbulence field around the ATREUS cube.UNCORRECTED PROOF4 Discussion and RecommendationsThe standard k-ε turbulence model has proven to be veryrobust and efficient with respect to computational requirementsand is by far the most widely used model inatmospheric flow and other environmental modelling370371372373374375376377378379380381382383384385386387388389390391392393394395396397398399400401402403t4.1 Table 4 Hit rate results for 10%and 20% agreement for thebuilding domain of CEDVALcube and ATREUS cubeModel CHENSI VADIS MIMO FLUENT10% 20% 10% 20% 10% 20% 10% 20%CEDVAL u 32.4 47.1 26.5 44.1 35.3 47.1 41.2 61.8w 5.9 11.8 14.7 20.6 5.9 8.8 2.9 11.8k 9.1 18.2 12.1 24.2 6.1 9.1 12.1 27.3ATREUS u 60.5 65.8 55.3 71.1 60.5 76.3 52.6 57.9w 7.9 18.4 10.5 21.1 7.9 18.4 10.5 21.1k 15.8 31.6 10.5 39.5 2.6 7.9 5.3 5.3t4.2t4.3t4.4t4.5t4.6t4.7t4.8t4.9