ANNUAL GLOBAL SURVEY 2011 - World Federation of Hemophilia
ANNUAL GLOBAL SURVEY 2011 - World Federation of Hemophilia
ANNUAL GLOBAL SURVEY 2011 - World Federation of Hemophilia

You also want an ePaper? Increase the reach of your titles
YUMPU automatically turns print PDFs into web optimized ePapers that Google loves.
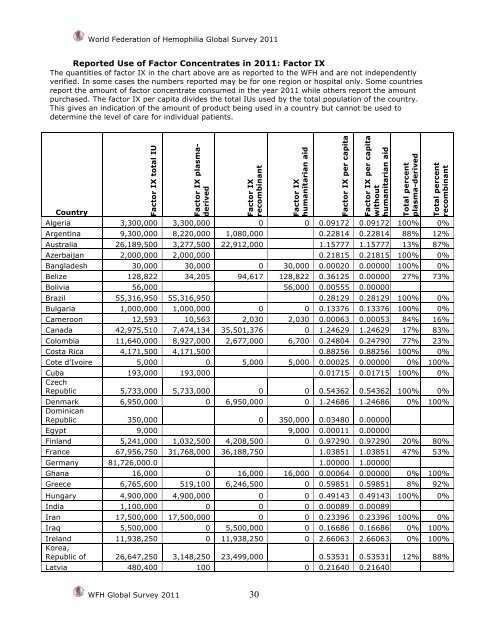
<strong>World</strong> <strong>Federation</strong> <strong>of</strong> <strong>Hemophilia</strong> Global Survey <strong>2011</strong>Reported Use <strong>of</strong> Factor Concentrates in <strong>2011</strong>: Factor IXThe quantities <strong>of</strong> factor IX in the chart above are as reported to the WFH and are not independentlyverified. In some cases the numbers reported may be for one region or hospital only. Some countriesreport the amount <strong>of</strong> factor concentrate consumed in the year <strong>2011</strong> while others report the amountpurchased. The factor IX per capita divides the total IUs used by the total population <strong>of</strong> the country.This gives an indication <strong>of</strong> the amount <strong>of</strong> product being used in a country but cannot be used todetermine the level <strong>of</strong> care for individual patients.CountryFactor IX total IUFactor IX plasmaderivedFactor IXrecombinantFactor IXhumanitarian aidFactor IX per capitaFactor IX per capitawithouthumanitarian aidAlgeria 3,300,000 3,300,000 0 0 0.09172 0.09172 100% 0%Argentina 9,300,000 8,220,000 1,080,000 0.22814 0.22814 88% 12%Australia 26,189,500 3,277,500 22,912,000 1.15777 1.15777 13% 87%Azerbaijan 2,000,000 2,000,000 0.21815 0.21815 100% 0%Bangladesh 30,000 30,000 0 30,000 0.00020 0.00000 100% 0%Belize 128,822 34,205 94,617 128,822 0.36125 0.00000 27% 73%Bolivia 56,000 56,000 0.00555 0.00000Brazil 55,316,950 55,316,950 0.28129 0.28129 100% 0%Bulgaria 1,000,000 1,000,000 0 0 0.13376 0.13376 100% 0%Cameroon 12,593 10,563 2,030 2,030 0.00063 0.00053 84% 16%Canada 42,975,510 7,474,134 35,501,376 0 1.24629 1.24629 17% 83%Colombia 11,640,000 8,927,000 2,677,000 6,700 0.24804 0.24790 77% 23%Costa Rica 4,171,500 4,171,500 0.88256 0.88256 100% 0%Cote d'Ivoire 5,000 0 5,000 5,000 0.00025 0.00000 0% 100%Cuba 193,000 193,000 0.01715 0.01715 100% 0%CzechRepublic 5,733,000 5,733,000 0 0 0.54362 0.54362 100% 0%Denmark 6,950,000 0 6,950,000 0 1.24686 1.24686 0% 100%DominicanRepublic 350,000 0 350,000 0.03480 0.00000Egypt 9,000 9,000 0.00011 0.00000Finland 5,241,000 1,032,500 4,208,500 0 0.97290 0.97290 20% 80%France 67,956,750 31,768,000 36,188,750 1.03851 1.03851 47% 53%Germany 81,726,000.0 1.00000 1.00000Ghana 16,000 0 16,000 16,000 0.00064 0.00000 0% 100%Greece 6,765,600 519,100 6,246,500 0 0.59851 0.59851 8% 92%Hungary 4,900,000 4,900,000 0 0 0.49143 0.49143 100% 0%India 1,100,000 0 0 0 0.00089 0.00089Iran 17,500,000 17,500,000 0 0 0.23396 0.23396 100% 0%Iraq 5,500,000 0 5,500,000 0 0.16686 0.16686 0% 100%Ireland 11,938,250 0 11,938,250 0 2.66063 2.66063 0% 100%Korea,Republic <strong>of</strong> 26,647,250 3,148,250 23,499,000 0.53531 0.53531 12% 88%Latvia 480,400 100 0 0.21640 0.21640Total percentplasma-derivedTotal percentrecombinantWFH Global Survey <strong>2011</strong> 30