2 Physical Properties of Marine Sediments - Blogs Unpad
2 Physical Properties of Marine Sediments - Blogs Unpad
2 Physical Properties of Marine Sediments - Blogs Unpad

Create successful ePaper yourself
Turn your PDF publications into a flip-book with our unique Google optimized e-Paper software.
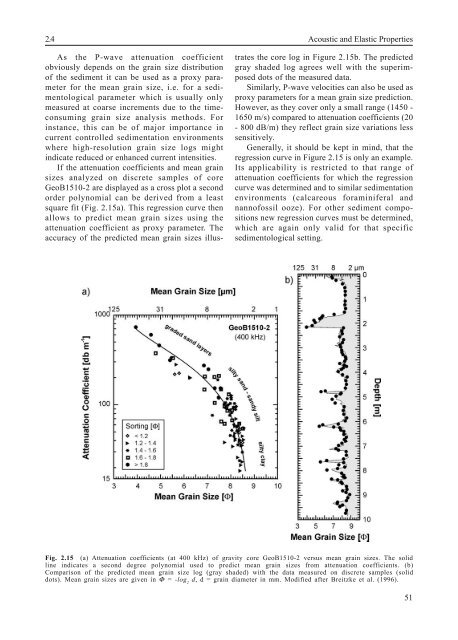
2.4 Acoustic and Elastic <strong>Properties</strong>As the P-wave attenuation coefficientobviously depends on the grain size distribution<strong>of</strong> the sediment it can be used as a proxy parameterfor the mean grain size, i.e. for a sedimentologicalparameter which is usually onlymeasured at coarse increments due to the timeconsuminggrain size analysis methods. Forinstance, this can be <strong>of</strong> major importance incurrent controlled sedimentation environmentswhere high-resolution grain size logs mightindicate reduced or enhanced current intensities.If the attenuation coefficients and mean grainsizes analyzed on discrete samples <strong>of</strong> coreGeoB1510-2 are displayed as a cross plot a secondorder polynomial can be derived from a leastsquare fit (Fig. 2.15a). This regression curve thenallows to predict mean grain sizes using theattenuation coefficient as proxy parameter. Theaccuracy <strong>of</strong> the predicted mean grain sizes illustratesthe core log in Figure 2.15b. The predictedgray shaded log agrees well with the superimposeddots <strong>of</strong> the measured data.Similarly, P-wave velocities can also be used asproxy parameters for a mean grain size prediction.However, as they cover only a small range (1450 -1650 m/s) compared to attenuation coefficients (20- 800 dB/m) they reflect grain size variations lesssensitively.Generally, it should be kept in mind, that theregression curve in Figure 2.15 is only an example.Its applicability is restricted to that range <strong>of</strong>attenuation coefficients for which the regressioncurve was determined and to similar sedimentationenvironments (calcareous foraminiferal andnann<strong>of</strong>ossil ooze). For other sediment compositionsnew regression curves must be determined,which are again only valid for that specificsedimentological setting.Fig. 2.15 (a) Attenuation coefficients (at 400 kHz) <strong>of</strong> gravity core GeoB1510-2 versus mean grain sizes. The solidline indicates a second degree polynomial used to predict mean grain sizes from attenuation coefficients. (b)Comparison <strong>of</strong> the predicted mean grain size log (gray shaded) with the data measured on discrete samples (soliddots). Mean grain sizes are given in Φ = -log 2d, d = grain diameter in mm. Modified after Breitzke et al. (1996).51