2 Physical Properties of Marine Sediments - Blogs Unpad
2 Physical Properties of Marine Sediments - Blogs Unpad
2 Physical Properties of Marine Sediments - Blogs Unpad
Create successful ePaper yourself
Turn your PDF publications into a flip-book with our unique Google optimized e-Paper software.
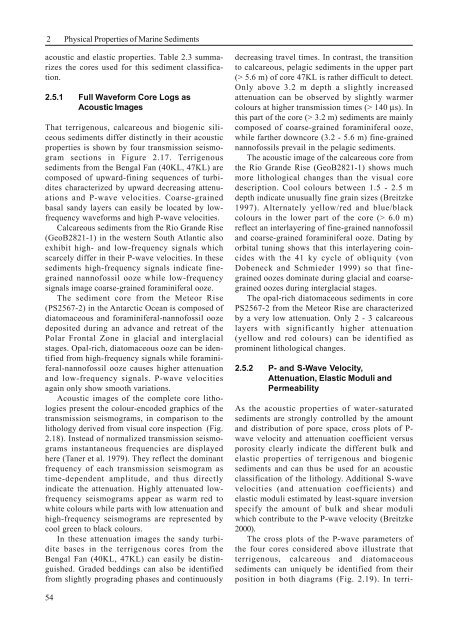
2<strong>Physical</strong> <strong>Properties</strong> <strong>of</strong> <strong>Marine</strong> <strong>Sediments</strong>acoustic and elastic properties. Table 2.3 summarizesthe cores used for this sediment classification.2.5.1 Full Waveform Core Logs asAcoustic ImagesThat terrigenous, calcareous and biogenic siliceoussediments differ distinctly in their acousticproperties is shown by four transmission seismogramsections in Figure 2.17. Terrigenoussediments from the Bengal Fan (40KL, 47KL) arecomposed <strong>of</strong> upward-fining sequences <strong>of</strong> turbiditescharacterized by upward decreasing attenuationsand P-wave velocities. Coarse-grainedbasal sandy layers can easily be located by lowfrequencywaveforms and high P-wave velocities.Calcareous sediments from the Rio Grande Rise(GeoB2821-1) in the western South Atlantic alsoexhibit high- and low-frequency signals whichscarcely differ in their P-wave velocities. In thesesediments high-frequency signals indicate finegrainednann<strong>of</strong>ossil ooze while low-frequencysignals image coarse-grained foraminiferal ooze.The sediment core from the Meteor Rise(PS2567-2) in the Antarctic Ocean is composed <strong>of</strong>diatomaceous and foraminiferal-nann<strong>of</strong>ossil oozedeposited during an advance and retreat <strong>of</strong> thePolar Frontal Zone in glacial and interglacialstages. Opal-rich, diatomaceous ooze can be identifiedfrom high-frequency signals while foraminiferal-nann<strong>of</strong>ossilooze causes higher attenuationand low-frequency signals. P-wave velocitiesagain only show smooth variations.Acoustic images <strong>of</strong> the complete core lithologiespresent the colour-encoded graphics <strong>of</strong> thetransmission seismograms, in comparison to thelithology derived from visual core inspection (Fig.2.18). Instead <strong>of</strong> normalized transmission seismogramsinstantaneous frequencies are displayedhere (Taner et al. 1979). They reflect the dominantfrequency <strong>of</strong> each transmission seismogram astime-dependent amplitude, and thus directlyindicate the attenuation. Highly attenuated lowfrequencyseismograms appear as warm red towhite colours while parts with low attenuation andhigh-frequency seismograms are represented bycool green to black colours.In these attenuation images the sandy turbiditebases in the terrigenous cores from theBengal Fan (40KL, 47KL) can easily be distinguished.Graded beddings can also be identifiedfrom slightly prograding phases and continuouslydecreasing travel times. In contrast, the transitionto calcareous, pelagic sediments in the upper part(> 5.6 m) <strong>of</strong> core 47KL is rather difficult to detect.Only above 3.2 m depth a slightly increasedattenuation can be observed by slightly warmercolours at higher transmission times (> 140 µs). Inthis part <strong>of</strong> the core (> 3.2 m) sediments are mainlycomposed <strong>of</strong> coarse-grained foraminiferal ooze,while farther downcore (3.2 - 5.6 m) fine-grainednann<strong>of</strong>ossils prevail in the pelagic sediments.The acoustic image <strong>of</strong> the calcareous core fromthe Rio Grande Rise (GeoB2821-1) shows muchmore lithological changes than the visual coredescription. Cool colours between 1.5 - 2.5 mdepth indicate unusually fine grain sizes (Breitzke1997). Alternately yellow/red and blue/blackcolours in the lower part <strong>of</strong> the core (> 6.0 m)reflect an interlayering <strong>of</strong> fine-grained nann<strong>of</strong>ossiland coarse-grained foraminiferal ooze. Dating byorbital tuning shows that this interlayering coincideswith the 41 ky cycle <strong>of</strong> obliquity (vonDobeneck and Schmieder 1999) so that finegrainedoozes dominate during glacial and coarsegrainedoozes during interglacial stages.The opal-rich diatomaceous sediments in corePS2567-2 from the Meteor Rise are characterizedby a very low attenuation. Only 2 - 3 calcareouslayers with significantly higher attenuation(yellow and red colours) can be identified asprominent lithological changes.2.5.2 P- and S-Wave Velocity,Attenuation, Elastic Moduli andPermeabilityAs the acoustic properties <strong>of</strong> water-saturatedsediments are strongly controlled by the amountand distribution <strong>of</strong> pore space, cross plots <strong>of</strong> P-wave velocity and attenuation coefficient versusporosity clearly indicate the different bulk andelastic properties <strong>of</strong> terrigenous and biogenicsediments and can thus be used for an acousticclassification <strong>of</strong> the lithology. Additional S-wavevelocities (and attenuation coefficients) andelastic moduli estimated by least-square inversionspecify the amount <strong>of</strong> bulk and shear moduliwhich contribute to the P-wave velocity (Breitzke2000).The cross plots <strong>of</strong> the P-wave parameters <strong>of</strong>the four cores considered above illustrate thatterrigenous, calcareous and diatomaceoussediments can uniquely be identified from theirposition in both diagrams (Fig. 2.19). In terri-54


