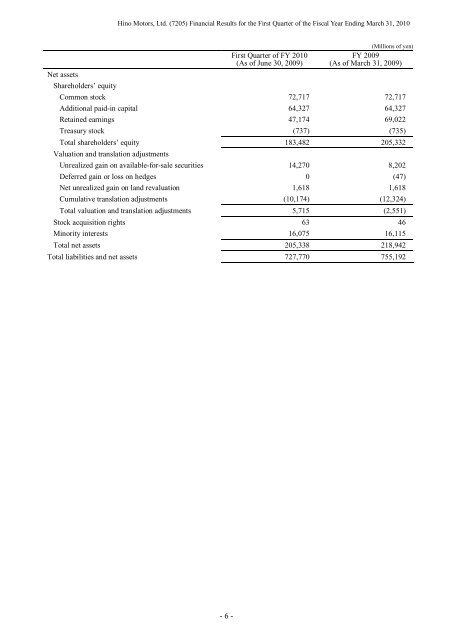
Hino Motors, Ltd. (7205) <strong>Financial</strong> <strong>Results</strong> for the First Quarter of the Fiscal Year Ending March 31, 2010Net assetsShareholders’ equityFirst Quarter of FY 2010(As of June 30, 2009)(Millions of yen)FY 2009(As of March 31, 2009)Common stock 72,717 72,717Additional paid-in capital 64,327 64,327Retained earnings 47,174 69,022Treasury stock (737) (735)Total shareholders’ equity 183,482 205,332Valuation and translation adjustmentsUnrealized gain on available-for-sale securities 14,270 8,202Deferred gain or loss on hedges 0 (47)Net unrealized gain on land revaluation 1,618 1,618Cumulative translation adjustments (10,174) (12,324)Total valuation and translation adjustments 5,715 (2,551)Stock acquisition rights 63 46Minority interests 16,075 16,115Total net assets 205,338 218,942Total liabilities and net assets 727,770 755,192- 6 -
Hino Motors, Ltd. (7205) <strong>Financial</strong> <strong>Results</strong> for the First Quarter of the Fiscal Year Ending March 31, 2010(2) Quarterly <strong>Consolidated</strong> Statements of Income[First Quarter of FY 2010 (Cumulative)]First Quarter of FY 2009(from April 1, 2008to June 30, 2008)(Millions of yen)First Quarter of FY 2010(from April 1, 2009to June 30, 2009)Net sales 318,923 165,524Cost of sales 276,297 154,081Gross profit on sales 42,625 11,443Selling, general and administrative expensesSalary and benefits 9,354 8,529Provision of accrued bonuses 1,128 925Provision of accrued retirement benefits 727 704Others 24,052 20,091Total selling, general and administrative expenses 35,263 30,250Operating income (loss) 7,362 (18,806)Non-operating incomeInterest income 348 346Dividends income 594 438Gain on foreign exchange 1,850 1,017Miscellaneous income 544 543Total non-operating income 3,338 2,346Non-operating expensesInterest expenses 1,140 1,191Investment loss on equity method 23 3,038Miscellaneous expenses 459 492Total non-operating expenses 1,623 4,722Ordinary income (loss) 9,076 (21,182)Extraordinary incomeGain on sale of fixed assets – 12Gain on sale of investment securities 2,141 –Others 135 73Total extraordinary income 2,277 85Extraordinary lossesLoss on sale or disposition of fixed assets 241 222Others 116 102Total extraordinary losses 358 325Net income (loss) before income taxes and minorityinterests10,995 (21,423)Income taxes 2,960 520Income taxes–deferred 397 (81)Total income taxes 3,358 439Minority interests income (loss) of consolidatedsubsidiaries747 (14)Net income (loss) 6,890 (21,847)- 7 -