Consolidated Financial Results - hino global
Consolidated Financial Results - hino global
Consolidated Financial Results - hino global

You also want an ePaper? Increase the reach of your titles
YUMPU automatically turns print PDFs into web optimized ePapers that Google loves.
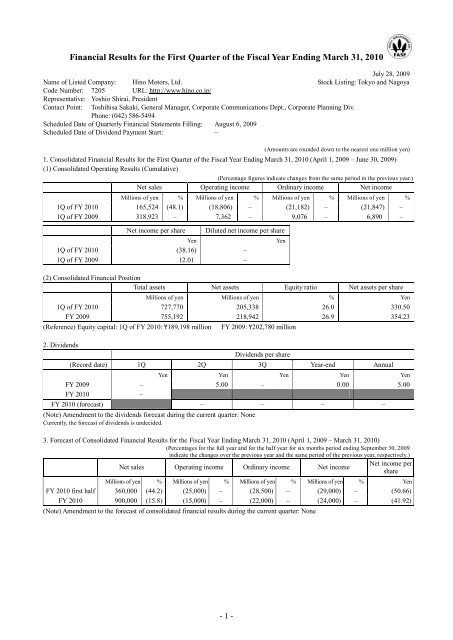
<strong>Financial</strong> <strong>Results</strong> for the First Quarter of the Fiscal Year Ending March 31, 2010July 28, 2009Name of Listed Company: Hino Motors, Ltd. Stock Listing: Tokyo and NagoyaCode Number: 7205 URL: http://www.<strong>hino</strong>.co.jp/Representative: Yoshio Shirai, PresidentContact Point:Toshihisa Sakaki, General Manager, Corporate Communications Dept., Corporate Planning Div.Phone: (042) 586-5494Scheduled Date of Quarterly <strong>Financial</strong> Statements Filling: August 6, 2009Scheduled Date of Dividend Payment Start: –(Amounts are rounded down to the nearest one million yen)1. <strong>Consolidated</strong> <strong>Financial</strong> <strong>Results</strong> for the First Quarter of the Fiscal Year Ending March 31, 2010 (April 1, 2009 – June 30, 2009)(1) <strong>Consolidated</strong> Operating <strong>Results</strong> (Cumulative)(Percentage figures indicate changes from the same period in the previous year.)Net sales Operating income Ordinary income Net incomeMillions of yen % Millions of yen % Millions of yen % Millions of yen %1Q of FY 2010 165,524 (48.1) (18,806) – (21,182) – (21,847) –1Q of FY 2009 318,923 – 7,362 – 9,076 – 6,890 –Net income per shareDiluted net income per shareYen1Q of FY 2010 (38.16) –1Q of FY 2009 12.01 –(2) <strong>Consolidated</strong> <strong>Financial</strong> PositionTotal assets Net assets Equity ratio Net assets per shareMillions of yen Millions of yen % Yen1Q of FY 2010 727,770 205,338 26.0 330.50FY 2009 755,192 218,942 26.9 354.23(Reference) Equity capital: 1Q of FY 2010: ¥189,198 million2. DividendsYenFY 2009: ¥202,780 millionDividends per share(Record date) 1Q 2Q 3Q Year-end AnnualYen Yen Yen Yen YenFY 2009 – 5.00 – 0.00 5.00FY 2010 –FY 2010 (forecast) – – – –(Note) Amendment to the dividends forecast during the current quarter: NoneCurrently, the forecast of dividends is undecided.3. Forecast of <strong>Consolidated</strong> <strong>Financial</strong> <strong>Results</strong> for the Fiscal Year Ending March 31, 2010 (April 1, 2009 – March 31, 2010)(Percentages for the full year and for the half year for six months period ending September 30, 2009indicate the changes over the previous year and the same period of the previous year, respectively.)Net income perNet sales Operating income Ordinary income Net incomeshareMillions of yen % Millions of yen % Millions of yen % Millions of yen % YenFY 2010 first half 360,000 (44.2) (25,000) – (28,500) – (29,000) – (50.66)FY 2010 900,000 (15.8) (15,000) – (22,000) – (24,000) – (41.92)(Note) Amendment to the forecast of consolidated financial results during the current quarter: None- 1 -
Hino Motors, Ltd. (7205) <strong>Financial</strong> <strong>Results</strong> for the First Quarter of the Fiscal Year Ending March 31, 20104. Others(1) Changes in significant subsidiaries (changes in specified subsidiaries resulting in changes in scope of consolidation) during thecurrent term: NoneNewly included: companies (Company name: ), Removed: companies (Company name: )(2) Application of simplified accounting methods/specified accounting methods for preparation of quarterly consolidated financialstatements: Yes(Note) For details, please see Section 4, Others in Qualitative Information / <strong>Financial</strong> Statements on Page 4.(3) Changes in accounting principles, procedures and methods of presentation associated with preparation of quarterly consolidatedfinancial statements (as indicated in Changes in the Basis for the Preparation of Quarterly <strong>Consolidated</strong> <strong>Financial</strong> Statements)1) Changes associated with revisions of accounting standards: None2) Change other than those included in 1): None(4) Number of outstanding shares (common stock)1) Number of outstanding shares (including treasury stock) at end of term: 1Q of FY 2010: 574,580,850 shares; FY 2009: 574,580,850 shares2) Number of treasury stock at end of term: 1Q of FY 2010: 2,126,366 shares; FY 2009: 2,120,176 shares3) Average number of shares (quarterly consolidated cumulative period): 1Q of FY 2010: 572,455,483 shares; 1Q of FY2009: 573,843,396 shares*Statement regarding the proper use of financial forecasts and other remarks1. Descriptions regarding the future, including the financial outlook contained in this material, are based on certain informationcurrently available to the Company and particular assumptions, which are, at the discretion of the Company, deemed reasonable,and actual financial results may significantly vary due to various factors. For assumptions used in forecasting financial resultsand instructions to use financial forecasts, please see Page 3, “3. Qualitative Information on Projected <strong>Consolidated</strong> <strong>Financial</strong><strong>Results</strong>” of “Qualitative Information/<strong>Financial</strong> Statements.”2. The dividend forecast for FY2010 is to be determined in consideration for the currently available financial forecasts and will beproposed later in the comprehensive view of actual performance and other factors.- 2 -
Hino Motors, Ltd. (7205) <strong>Financial</strong> <strong>Results</strong> for the First Quarter of the Fiscal Year Ending March 31, 2010[Qualitative Information / <strong>Financial</strong> Statements]1. Qualitative Information on <strong>Consolidated</strong> Operating <strong>Results</strong>During the first quarter under review Japan suffered from severe economic conditions such as worsening corporateprofits and reduced capital expenditure. However, the recession was bottoming out as part of exports and productionpicked up.For the market of domestic heavy- and medium-duty trucks, total demand decreased to 7 thousand units by 10thousand units (58.5% down) from the same period of the previous year due to declining corporate earnings caused by theslow economy. Total demand in the light-duty truck market also fell by 9 thousand units (48.2% down) to 9 thousandunits on a year-over-year basis.Affected by decreased demand, Japan unit sales decreased by 5 thousand units (52.6% down) to 4 thousand units fromthe year-earlier period as the total of trucks and buses.For the overseas market, unit sales of trucks and buses overseas in the consolidated fiscal year were 12 thousandunits, decreasing by 7 thousand units (36.1% down) from the previous year, against the background of the worldwideeconomic recession.Accordingly, total unit sales of Hino brand trucks and buses amounted to 16 thousand units, fell by 11 thousand units(41.4% down) from the corresponding period of a year earlier.As for vehicle production commissioned by Toyota Motor Corporation, total production was 16 thousand units,decreasing by 29 thousand units (64.7% down) from the corresponding period of a year earlier due to the decreasedproduction in “HILUX SURF” and “FJ Cruiser” mainly aimed at the United States. The commissioned part supplyservice for Toyota-branded vehicles in overseas subsidiaries also dropped in net sales.Accordingly, net sales amounted to ¥165,524 million, falling ¥153,398 million (48.1% down) from a year earlierbecause of the decrease in all the major operations stated above. The Company’s efforts for the cost improvement andfixed cost reduction were unable to make up the fall in profits brought about by the significant decrease in net sales. As aresult, operating loss, ordinary loss and net loss for the quarter were ¥18,806 million, ¥21,182 million and ¥21,847million, respectively, all of which were lower than the year-ago quarter.2. Qualitative Information on <strong>Consolidated</strong> <strong>Financial</strong> PositionTotal assets at the end of the current quarter decreased by ¥27,422 million to ¥727,770 million compared with the endof the preceding fiscal year. This was because of the ¥5,706 million decrease in cash and deposits and ¥16,154 milliondecrease in receivables due to fewer recent unit sales at the end of the current quarter than the one at the end of theprevious fiscal year.Liabilities fell to ¥522,432 million, which was a decrease of ¥13,817 million from the end of the preceding fiscal year.This was because of the ¥8,630 million decrease in payables and the drop of ¥3,620 million in interest-bearing debt.Net assets decreased by ¥13,604 million to ¥205,338 million from the end of the previous fiscal year. This was due tothe net loss for the quarter of ¥21,847 million despite the increase of ¥6,068 million in unrealized gain on investments inlisted securities brought about by rising share prices.3. Qualitative Information on Forecast of <strong>Consolidated</strong> <strong>Financial</strong> <strong>Results</strong>In Fiscal year 2010 Japan is expected to see the outcome of the economic crisis measures taken by the government anda pickup in exports and production. There are, however, several concerns, including the slow economic recovery indeveloped countries such as Europe and the United States and price hike in part of resources, all of which still require acautious response in both Japan and overseas markets.Under these circumstances the Group will seek enhanced management practices and improved business performanceby promoting further rationalization.Forecast of consolidated financial results for the year ending March, 2010 is as follows;Net sales····································································¥900 billionOperating loss ·························································· ¥(15) billionJapan unit sales of trucks and buses··················· 29 thousand unitsOverseas unit sales of trucks and buses ············· 50 thousand unitsProduction of Toyota brand vehicles ················111 thousand units- 3 -
Hino Motors, Ltd. (7205) <strong>Financial</strong> <strong>Results</strong> for the First Quarter of the Fiscal Year Ending March 31, 20104. Others(1) Changes in significant subsidiaries (changes of specified subsidiaries resulting in changes in scope of consolidation)during the current termNone.(2) Application of simplified accounting methods/specified accounting methods for preparation of quarterlyconsolidated financial statements1. Simplified accounting methods1)Inventory valuation methodIn regard to the calculation of the ending inventory for the first quarter under review, the Company omittedphysical inventory and used a reasonable calculation method based on the physical inventory at the end of theprevious consolidated fiscal year.2) Calculation method for current income taxes and deferred income taxes (deferred tax assets/liabilities)Payable income taxes are derived from the calculation, in which limited important add/subtract items and tax credititems were taken into account.The collectability of deferred tax assets is subject to the method, which takes into account variations in significantprovisional changes from the end of the previous consolidated fiscal year in addition to the projected future financialresults and tax planning used in the year-end review for the prior consolidated fiscal year.(3) Changes in accounting principles/procedures and method of presentation associated with preparation of quarterlyconsolidated financial statementsNone.- 4 -
5. Quarterly <strong>Consolidated</strong> <strong>Financial</strong> Statements(1) Quarterly <strong>Consolidated</strong> Balance SheetsAssetsCurrent assetsHino Motors, Ltd. (7205) <strong>Financial</strong> <strong>Results</strong> for the First Quarter of the Fiscal Year Ending March 31, 2010First Quarter of FY 2010(As of June 30, 2009)(Millions of yen)FY 2009(As of March 31, 2009)Cash and deposits 24,018 29,725Trade notes and accounts receivable 133,299 149,453Merchandise and finished goods 58,966 61,554Work in progress 21,116 22,649Raw materials and supplies 15,933 16,634Others 23,595 26,493Allowance for doubtful accounts (2,940) (3,012)Total current assets 273,989 303,498Fixed assetsTangible fixed assetsBuildings and structures (net) 96,637 97,139Machinery and transportation equipment (net) 91,866 93,494Land 90,793 90,659Others (net) 64,743 65,804Total tangible fixed assets 344,041 347,097Intangible fixed assets 25,083 26,698Investments and other assetsInvestment securities 70,166 61,874Others 20,117 21,550Allowance for doubtful accounts (5,628) (5,528)Total investments and other assets 84,655 77,896Total fixed assets 453,780 451,693Total assets 727,770 755,192LiabilitiesCurrent liabilitiesTrade notes and accounts payable 101,642 110,272Short-term loans payable 122,912 121,585Commercial papers 20,000 79,500Current portion of long-term loans payable 22,050 20,762Accrued income taxes 1,298 1,725Accrued bonuses 5,570 3,786Warranty allowance 9,904 12,095Others 54,818 58,241Total current liabilities 338,197 407,969Long-term liabilitiesLong-term loans payable 103,086 49,822Accrued employees’ retirement benefits 41,179 40,924Others 39,968 37,533Total long-term liabilities 184,234 128,280Total liabilities 522,432 536,250- 5 -
Hino Motors, Ltd. (7205) <strong>Financial</strong> <strong>Results</strong> for the First Quarter of the Fiscal Year Ending March 31, 2010Net assetsShareholders’ equityFirst Quarter of FY 2010(As of June 30, 2009)(Millions of yen)FY 2009(As of March 31, 2009)Common stock 72,717 72,717Additional paid-in capital 64,327 64,327Retained earnings 47,174 69,022Treasury stock (737) (735)Total shareholders’ equity 183,482 205,332Valuation and translation adjustmentsUnrealized gain on available-for-sale securities 14,270 8,202Deferred gain or loss on hedges 0 (47)Net unrealized gain on land revaluation 1,618 1,618Cumulative translation adjustments (10,174) (12,324)Total valuation and translation adjustments 5,715 (2,551)Stock acquisition rights 63 46Minority interests 16,075 16,115Total net assets 205,338 218,942Total liabilities and net assets 727,770 755,192- 6 -
Hino Motors, Ltd. (7205) <strong>Financial</strong> <strong>Results</strong> for the First Quarter of the Fiscal Year Ending March 31, 2010(2) Quarterly <strong>Consolidated</strong> Statements of Income[First Quarter of FY 2010 (Cumulative)]First Quarter of FY 2009(from April 1, 2008to June 30, 2008)(Millions of yen)First Quarter of FY 2010(from April 1, 2009to June 30, 2009)Net sales 318,923 165,524Cost of sales 276,297 154,081Gross profit on sales 42,625 11,443Selling, general and administrative expensesSalary and benefits 9,354 8,529Provision of accrued bonuses 1,128 925Provision of accrued retirement benefits 727 704Others 24,052 20,091Total selling, general and administrative expenses 35,263 30,250Operating income (loss) 7,362 (18,806)Non-operating incomeInterest income 348 346Dividends income 594 438Gain on foreign exchange 1,850 1,017Miscellaneous income 544 543Total non-operating income 3,338 2,346Non-operating expensesInterest expenses 1,140 1,191Investment loss on equity method 23 3,038Miscellaneous expenses 459 492Total non-operating expenses 1,623 4,722Ordinary income (loss) 9,076 (21,182)Extraordinary incomeGain on sale of fixed assets – 12Gain on sale of investment securities 2,141 –Others 135 73Total extraordinary income 2,277 85Extraordinary lossesLoss on sale or disposition of fixed assets 241 222Others 116 102Total extraordinary losses 358 325Net income (loss) before income taxes and minorityinterests10,995 (21,423)Income taxes 2,960 520Income taxes–deferred 397 (81)Total income taxes 3,358 439Minority interests income (loss) of consolidatedsubsidiaries747 (14)Net income (loss) 6,890 (21,847)- 7 -
(3) Notes on going concern assumptionNone.Hino Motors, Ltd. (7205) <strong>Financial</strong> <strong>Results</strong> for the First Quarter of the Fiscal Year Ending March 31, 2010(4) Notes on significant changes in the amount of shareholders’ equityThere is no related information.6. Other Information(1) Actual productionCategory1Q of FY 2009(from April 1, 2008to June 30, 2008)1Q of FY 2010(from April 1, 2009to June 30, 2009)ChangeTrucks and buses 27,987 units 13,209 units (14,778) unitsToyota brand vehicles 45,388 units 16,007 units (29,381) units(2) Actual salesCategory1Q of FY 2009(from April 1, 2008to June 30, 2008)Quantity(units)Amount(millions of yen)1Q of FY 2010(from April 1, 2009to June 30, 2009)Quantity(units)Amount(millions of yen)Quantity(units)ChangeAmount(millions of yen)Japan 8,790 63,422 4,167 31,022 (4,623) (32,399)Overseas 18,556 72,535 11,859 43,156 (6,697) (29,379)Total trucks and buses 27,346 135,958 16,026 74,179 (11,320) (61,778)Vehicles 45,388 79,846 16,007 25,365 (29,381) (54,480)Supplies and parts foroverseas production– 1,880 – 1,176 – (704)Total Toyota brand 45,388 81,726 16,007 26,541 (29,381) (55,185)Japan – 11,797 – 10,674 – (1,123)Overseas – 5,634 – 5,133 – (501)Total service parts – 17,432 – 15,808 – (1,624)Japan – 40,705 – 25,196 – (15,509)Overseas – 6,479 – 4,127 – (2,351)Toyota – 36,620 – 19,672 – (16,948)Total others – 83,806 – 48,996 – (34,810)Total net sales – 318,923 – 165,524 – (153,398)(Note) Amounts are rounded down to the nearest one million yen.- 8 -