Consolidated Financial Results (200KB | 32P) - hino global
Consolidated Financial Results (200KB | 32P) - hino global
Consolidated Financial Results (200KB | 32P) - hino global

Create successful ePaper yourself
Turn your PDF publications into a flip-book with our unique Google optimized e-Paper software.
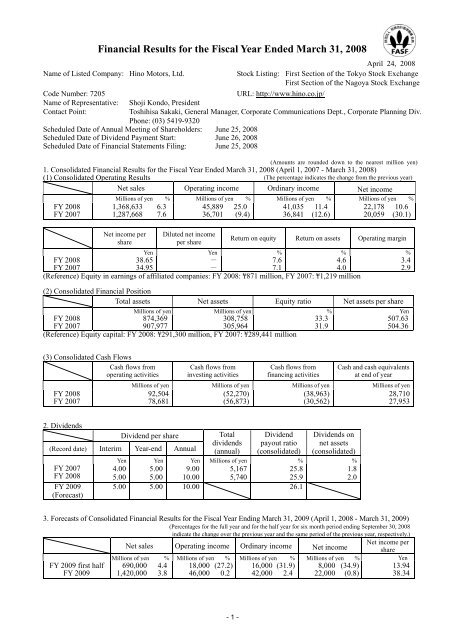
<strong>Financial</strong> <strong>Results</strong> for the Fiscal Year Ended March 31, 2008Name of Listed Company: Hino Motors, Ltd.Code Number: 7205Name of Representative:Contact Point:April 24, 2008Stock Listing: First Section of the Tokyo Stock ExchangeFirst Section of the Nagoya Stock ExchangeURL: http://www.<strong>hino</strong>.co.jp/Shoji Kondo, PresidentToshihisa Sakaki, General Manager, Corporate Communications Dept., Corporate Planning Div.Phone: (03) 5419-9320Scheduled Date of Annual Meeting of Shareholders: June 25, 2008Scheduled Date of Dividend Payment Start: June 26, 2008Scheduled Date of <strong>Financial</strong> Statements Filing: June 25, 2008(Amounts are rounded down to the nearest million yen)1. <strong>Consolidated</strong> <strong>Financial</strong> <strong>Results</strong> for the Fiscal Year Ended March 31, 2008 (April 1, 2007 - March 31, 2008)(1) <strong>Consolidated</strong> Operating <strong>Results</strong> (The percentage indicates the change from the previous year)Net sales Operating income Ordinary income Net incomeMillions of yen % Millions of yen % Millions of yen % Millions of yen %FY 2008FY 20071,368,633 6.31,287,668 7.6Net income pershareDiluted net incomeper share45,889 25.036,701 (9.4)41,035 11.436,841 (12.6)22,178 10.620,059 (30.1)Return on equity Return on assets Operating marginYen Yen % % %FY 200838.65-7.64.6FY 200734.95-7.14.0(Reference) Equity in earnings of affiliated companies: FY 2008: ¥871 million, FY 2007: ¥1,219 million(2) <strong>Consolidated</strong> <strong>Financial</strong> PositionTotal assets Net assets Equity ratio Net assets per shareMillions of yen Millions of yen % YenFY 2008FY 2007874,369907,977308,758305,964(Reference) Equity capital: FY 2008: ¥291,300 million, FY 2007: ¥289,441 million33.331.93.42.9507.63504.36(3) <strong>Consolidated</strong> Cash FlowsCash flows fromoperating activitiesFY 2008FY 2007Cash flows frominvesting activitiesCash flows fromfinancing activitiesCash and cash equivalentsat end of yearMillions of yen Millions of yen Millions of yen Millions of yen92,50478,681(52,270)(56,873)(38,963)(30,562)28,71027,9532. DividendsDividend per share(Record date) Interim Year-end AnnualFY 2007FY 2008FY 2009(Forecast)Totaldividends(annual)Dividendpayout ratio(consolidated)Dividends onnet assets(consolidated)Yen Yen Yen Millions of yen % %4.00 5.00 9.00 5,16725.85.00 5.00 10.00 5,74025.95.00 5.00 10.00 26.11.82.03. Forecasts of <strong>Consolidated</strong> <strong>Financial</strong> <strong>Results</strong> for the Fiscal Year Ending March 31, 2009 (April 1, 2008 - March 31, 2009)(Percentages for the full year and for the half year for six month period ending September 30, 2008FY 2009 first halfFY 2009indicate the change over the previous year and the same period of the previous year, respectively.)Net income perNet sales Operating income Ordinary income Net income shareMillions of yen % Millions of yen % Millions of yen % Millions of yen % Yen690,000 4.41,420,000 3.818,000 (27.2)46,000 0.216,000 (31.9)42,000 2.48,000 (34.9)22,000 (0.8)13.9438.34- 1 -
Hino Motors, Ltd. (7205) <strong>Financial</strong> <strong>Results</strong> for the Fiscal Year Ended March 31, 20084. Others(1) Changes in significant subsidiaries(changes in specified subsidiaries resulting in changes in scope of consolidation): None(2) Changes in accounting principles, procedures and methods of presentation associated with preparation ofconsolidated financial statements1) Changes associated with revisions of accounting standards: Yes2) Changes other than those included in 1): None(Note) For details, please see Page 18, “Changes in Basis for Presenting <strong>Consolidated</strong> <strong>Financial</strong> Statements.”(3) Number of shares issued and outstanding (common stock)1) Number of outstanding shares (including treasury shares) at end of year:FY 2008: 574,580,850 shares, FY 2007: 574,580,850 shares2) Number of treasury shares at end of year:FY 2008: 732,342 shares, FY 2007: 696,807 shares(Note) For the number of shares, based on which net income per share (consolidated) is calculated, please seePage 20, "Per Share Information."(Reference) Overview of Non-<strong>Consolidated</strong> <strong>Financial</strong> <strong>Results</strong>1. Non-<strong>Consolidated</strong> <strong>Financial</strong> <strong>Results</strong> for the Fiscal Year Ended March 31, 2008 (April 1, 2007 - March 31, 2008)(1) Non-<strong>Consolidated</strong> Operating <strong>Results</strong> (Percentages indicate the change from the previous year)Net sales Operating income Ordinary income Net incomeMillions of yen % Millions of yen % Millions of yen % Millions of yen %FY 2008FY 2007FY 2008FY 20071,034,155 5.9976,683 6.2Net income per shareYen7.7828.7429,267 13.025,910 (25.8)Diluted net income pershareYen--28,759 0.428,658 (25.6)4,467 (72.9)16,501 (24.2)(2) Non-<strong>Consolidated</strong> <strong>Financial</strong> PositionTotal assets Net assets Equity ratio Net assets per shareMillions of yen Millions of yen % YenFY 2008594,317287,046FY 2007602,435297,768(Reference) Equity capital is equivalent to net assets as there is no equity warrant.48.349.4500.06518.672. Forecasts of Non-<strong>Consolidated</strong> <strong>Financial</strong> <strong>Results</strong> for the Fiscal Year Ending March 31, 2009(April 1, 2008 - March 31, 2009)(Percentages for the full year and for the half year for six month period ending September 30, 2009FY 2009 first halfFY 2009indicate the change over the previous year and the same period of the previous year, respectively.)Net salesOperating OrdinaryNet incomeincomeincome Net income per shareMillions of yen % Millions of yen % Millions of yen % Millions of yen % Yen530,000 5.91,080,00 4.49,000 (51.5)26,000 (11.2)12,200 (40.7)29,800 3.67,400 (43.8)18,000 302.912.8931.36* Statement regarding the proper use of financial forecasts and other remarks(Notes on descriptions regarding the future)Descriptions regarding the future, including the financial outlook contained in this material, are based on certaininformation currently available to the Company and particular assumptions, which are, at the discretion of theCompany, deemed reasonable, and actual financial results may significantly vary due to various factors.For assumptions used in forecasting financial results and instructions to use financial forecasts, please see Page 3,“Operating results, (1) Analysis on operating results.”- 2 -
Hino Motors, Ltd. (7205) <strong>Financial</strong> <strong>Results</strong> for the Fiscal Year Ended March 31, 20081. Operating <strong>Results</strong>(1) Analysis of Operating <strong>Results</strong>1. Operating <strong>Results</strong> for the Fiscal Year Ended March 31, 2008During the consolidated fiscal year under review, Japan’s economy was on a trend for gradualexpansion, brought about by increase in corporate capital expenditure and exporting as well asrobust consumer spending despite the soaring costs of oil and raw materials. The <strong>global</strong>economy was generally strong as a high rate of growth was seen in emerging countries such asRussia, China, India and Middle Eastern nations, although some slowdown was observed inthe United States.For the market of domestic heavy- and medium-duty trucks, which were the Group’s flagshipproducts, total demand for the consolidated fiscal year under review decreased to 85,000 unitsby 20,000 units (19.3% down) from the previous year as the substitute demand, which hadbeen brought by control on exhaust emissions from diesel-powered vehicles since 2003,subsided in the second half of the previous year. Total demand in the light-duty truck marketalso fell by 31,000 units to 90,000 units (25.7% down) from the previous year.Affected by decreased demand, domestic unit sales decreased by 6,000 units to 46,000 units(10.9% down) from the previous year as the total of heavy-, medium- and light-duty trucksand buses.Overseas unit sales of trucks and buses, on the other hand, significantly increased from theprevious year due to rising demand in Asia, Latin America and Middle Eastern regions. As aresult, record-high sales of 66,000 units were achieved, increasing by 15,000 units (29.4% up)from the prior year.Accordingly, total unit sales of Hino-branded trucks and buses amounted to 112,000 units,growing by 9,000 units (9.1% up) from the previous year.As for vehicle production commissioned by Toyota Motor Corporation, total production was201,000 units, decreasing by 2,000 units (1.1% down) from the previous year. This wasbecause production of the FJ Cruiser mainly for the U.S. market dropped, although Hilux Surffor export increased in its production. In March 2008, production of the Land Cruiser Pradostarted. The commissioned part supply service for Toyota-branded vehicles in overseassubsidiaries showed favorable performance, backed by received orders of suspension-relatedparts for new models in the United States<strong>Consolidated</strong> net sales for the consolidated fiscal year under review amounted to ¥1,368,633million, rising by ¥80,965 million (6.3% up) from the previous year because of increase in unitsales of Hino-branded vehicles in foreign markets and favorable business in the commissionedpart supply service of overseas subsidiaries. Increases in overseas unit sales, revenue growth inoverseas subsidiaries and promotion of cost reduction brought about remarkable results: theconsolidated operating income of ¥45,889 million, increasing by ¥9,187 million (25.0% up)from the previous year; the consolidated ordinary income of ¥41,035 million, growing by¥4,193 million (11.4% up) and consolidated net income of ¥22,178 million, rising by ¥2,119million (10.6% up) from the prior year. Net sales and operating income hit all-time high.- 3 -
Hino Motors, Ltd. (7205) <strong>Financial</strong> <strong>Results</strong> for the Fiscal Year Ended March 31, 20082. Outlook for the Fiscal Year Ending March 31, 2009In the fiscal year 2009, exports are expected to increase, buoyed by high growth in China andother countries as Japan’s economy is showing its underlying strength in capital expenditureand consumer spending. There are, however, several causes for concern, including the slowingU.S. economy and its potential impact on the <strong>global</strong> market, price hikes in oil, raw materialsand others, and unstable trends in the exchange and stock markets, all of which require acautious response according to the future business climate.The domestic market for trucks, which are the Group’s main products, is anticipated to remainin difficult circumstances brought about by high price of crude oil and streamlined logistics.Meanwhile, in foreign markets, despite some concerns such as the sluggish truck market in theUnited States, sales are generally expected to remain strong due to the increasing demand inresource-supplying countries and as a result of successful measures that the Group has workedon, such as reinforcement in the <strong>global</strong> production and sales system, which covers new entryinto markets and the building of new factories.Under these circumstances the Group will seek enhanced management practices and improvedbusiness performance by promoting further rationalization.Outlook of consolidated business performance for FY2009 is as follows:Net sales ······································································¥1,420 billionOperating income ·····························································¥46 billionDomestic unit sales of trucks and buses························ 45,000 unitsOverseas unit sales of trucks and buses························· 79,000 unitsProduction of vehicles commissioned by Toyota ········ 218,000 units- 4 -
Hino Motors, Ltd. (7205) <strong>Financial</strong> <strong>Results</strong> for the Fiscal Year Ended March 31, 2008(2) Analysis on <strong>Financial</strong> Position1. Assets, Liabilities and Net AssetsTotal assets at the end of the consolidated fiscal year under review decreased by ¥33,608million to ¥874,369 million compared with the end of the previous year. This was because ofthe decrease of ¥25,615 million in receivables due mainly to weak domestic sales, and thedrop of ¥21,845 million in investment securities arising from fall of stock prices, althoughinventories increased by ¥9,031 million.Liabilities fell to ¥565,610 million, which was a decrease of ¥36,403 million from the end ofthe previous year due primarily to the drop of interest-bearing debt. Net assets amounted to¥308,758 million, increasing by ¥2,794 million from the previous year. This was attributed tothe net income of ¥22,178 million despite the decrease of ¥11,449 million in unrealized gainson investments in listed securities due to the dividend payment of ¥5,740 million and thedecline of stock prices.2. Cash FlowsCash flows at the end of the consolidated fiscal year under review increased by ¥756 millionfrom the previous year, with cash and cash equivalents at end of year of ¥28,710 million.Increase of cash flow from operating activities amounted to ¥92,504 million. This was becauseof the growth in cash due to net income before income taxes and minority interests of ¥36,885million and depreciation of ¥51,002 million.Cash flows from investing activities decreased to ¥52,270 million. This was attributable to theexpenditure of ¥39,299 million on the acquisition of fixed assets focusing on productionfacilities.Decline in cash flows from financing activities amounted to ¥38,963 million. This was due tothe expenditure of ¥27,079 million on repayment of long-term loans payable and the paymentof ¥5,740 million for cash dividends.(3) Basic Policy on Profit Distribution and Dividends for FY2008 and FY2009The Company has basic policies to reinforce its financial strength and provide improveddistribution of outcomes by taking into account relevant factors such as business performance,new investments and the consolidated dividend payout ratio of each year. The year-enddividend will be ¥5 per share, which is the same as the previous year. As a result, the annualtotal of dividends is expected to be ¥10, including the interim dividend of ¥5, which was paidin November 2007, and the resultant (consolidated) payout ratio will be 25.9% for FY2008.Retained earnings will be appropriated to some purposes including capital expenditure forimplementation of structural reform in business.Dividends per share for FY2009 are planned to be an annual total of ¥10, consisting of theinterim dividend of ¥5 and the year-end dividend of ¥5.2. Hino Motors GroupAs no material change has occurred with respect to the matters of “the schematic diagram ofthe Company’s businesses” and “affiliated companies” submitted in the recent financialstatements (submitted on June 26, 2007), disclosure is omitted.- 5 -
Hino Motors, Ltd. (7205) <strong>Financial</strong> <strong>Results</strong> for the Fiscal Year Ended March 31, 20083. Operating PolicyDisclosure is omitted because there is no significant change from the details disclosed in the<strong>Financial</strong> <strong>Results</strong> for the Fiscal Year Ended March 31, 2007 (disclosed on April 25, 2007).The relevant earnings briefing can be found at:(The Company’s website)http://www.<strong>hino</strong>.co.jp/(Website of the Tokyo Stock Exchange (page to search data on listed companies))http://www.tse.or.jp/listing/compsearch/index.html- 6 -
Hino Motors, Ltd. (7205) <strong>Financial</strong> <strong>Results</strong> for the Fiscal Year Ended March 31, 20084. Production and Sales (<strong>Consolidated</strong>)(1) Actual ProductionFY2007FY2008Category from April 1, 2006 from April 1, 2007to March 31, 2007 to March 31, 2008ChangeTrucks and buses 99,511 units 110,279 units 10,768 unitsCommissioned vehicles 203,066 units 200,929 units (2,137) units(2) Actual Sales (<strong>Consolidated</strong>)FY2007FY2008from April 1, 2006 from April 1, 2007 ChangeCategory to March 31, 2007 to March 31, 2008Quantity Value Quantity Value Quantity Value(in units) (millions of yen) (in units) (millions of yen) (in units) (millions of yen)Domestic 51,434 361,169 45,806 321,374 (5,628) (39,794)Overseas 50,901 205,286 65,871 276,767 14,970 71,480Total trucks and buses 102,335 566,455 111,677 598,142 9,342 31,686Vehicles 203,066 350,750 200,929 357,747 (2,137) 6,996Supplies and parts foroverseas production- 5,043 - 6,134 - 1,091Total commissioned vehicles 203,066 355,793 200,929 363,882 (2,137) 8,088Domestic - 49,182 - 48,722 - (459)Overseas - 16,355 - 17,198 - 843Total supplies and parts - 65,538 - 65,921 - 383Domestic - 169,086 - 160,431 - (8,654)Overseas - 12,019 - 21,561 - 9,542Toyota - 118,774 - 158,693 - 39,918Total others - 299,880 - 340,687 - 40,806Total net sales - 1,287,668 - 1,368,633 - 80,965(Note) Values are rounded down to the nearest million yen.- 7 -
Hino Motors, Ltd. (7205) <strong>Financial</strong> <strong>Results</strong> for the Fiscal Year Ended March 31, 20085. <strong>Consolidated</strong> <strong>Financial</strong> Statements(1) <strong>Consolidated</strong> Balance Sheets (millions of yen)FY2007As of March 31, 2007FY2008As of March 31, 2008Change fromthe prior yearAccountAmountComposition(%)AmountComposition(%)Change(Assets)I. Current assets1. Cash and deposits 28,696 29,1082. Trade notes and accountsreceivable264,141 238,5263. Inventories 93,534 102,5654. Deferred income taxes 14,844 16,7165. Others 14,498 16,9286. Allowance for doubtfulaccountsII. Fixed assets(4,053) (3,729)Total current assets 411,662 45.3 400,115 45.8 (11,547)(1) Tangible fixed assets1. Buildings and structures 109,157 106,5232. Machinery andtransportation equipment105,478 108,8663. Tools and fixtures 17,744 14,1994. Lease assets 9,749 10,2885. Land 96,067 95,4096. Construction in progress 16,781 9,520Total tangible fixedassets(2) Intangible fixed assets354,979 39.1 344,807 39.4 (10,172)1. Software 21,749 25,2172. Goodwill 81 -3. Others 554 498Total intangible fixedassets22,385 2.5 25,716 2.9 3,330- 8 -
Hino Motors, Ltd. (7205) <strong>Financial</strong> <strong>Results</strong> for the Fiscal Year Ended March 31, 2008FY2007As of March 31, 2007FY2008As of March 31, 2008(millions of yen)Change fromthe prior yearAccount(3) Investments and otherassetsAmountComposition(%)Amount1. Investment securities 108,412 86,5662. Long-term loansreceivable3,644 3,5713. Deferred income taxes 2,744 2,1074. Other investments andassets5. Allowance for doubtfulaccountsTotal investments and otherassets10,048 17,555(5,898) (6,070)Composition(%)Change118,950 13.1 103,730 11.9 (15,219)Total fixed assets 496,315 54.7 474,254 54.2 (22,061)Total assets 907,977 100.0 874,369 100.0 (33,608)(Liabilities)I. Current liabilities1. Trade notes and accountspayable192,049 195,7412. Short-term loans payable 135,965 114,6233. Commercial paper 39,000 32,0004. Current portion oflong-term loans payable27,753 23,6185. Other accounts payable 10,496 13,3126. Accrued income taxes 6,262 9,2767. Accrued bonuses 4,383 4,5268. Accrued directors’ bonuses 370 5039. Warranty allowance 10,633 10,93510. Other current liabilities 49,793 52,444Total current liabilities 476,705 52.5 456,983 52.3 (19,722)- 9 -
Hino Motors, Ltd. (7205) <strong>Financial</strong> <strong>Results</strong> for the Fiscal Year Ended March 31, 2008FY2007As of March 31, 2007FY2008As of March 31, 2008(millions of yen)Change fromthe prior yearAccountAmountComposition(%)AmountComposition(%)ChangeII. Long-term liabilities1. Long-term loans payable 43,842 37,6302. Deferred income taxes 17,181 4,7613. Deferred income taxesrelated to unrealized gain3,732 3,732on land revaluation4. Accrued employees’retirement benefits36,639 37,0905. Accrued directors’retirement benefits- 2,8006. Other long-term liabilities 23,912 22,612Total long-termliabilities125,307 13.8 108,627 12.4 (16,680)Total liabilities 602,013 66.3 565,610 64.7 (36,403)(Net assets)I. Shareholders’ equity1. Common stock 72,717 8.0 72,717 8.3 -2. Additional paid-in capital 64,309 7.1 64,327 7.3 173. Retained earnings 120,026 13.2 136,393 15.6 16,3674. Treasury stock (325) (0.0) (379) (0.0) (54)Total shareholders’equity256,728 28.3 273,058 31.2 16,330II. Valuation and translationadjustments1. Unrealized gain onavailable-for-sale33,388 3.7 21,939 2.5 (11,449)securities2. Net unrealized gain onland revaluation1,547 0.2 1,617 0.2 703. Cumulative translationadjustment(2,222) (0.3) (5,315) (0.6) (3,092)Total valuation andtranslation32,713 3.6 18,241 2.1 (14,471)adjustmentsIII. Minority interests 16,522 1.8 17,458 2.0 935Total net assets 305,964 33.7 308,758 35.3 2,794Total liabilities and netassets907,977 100.0 874,369 100.0 (33,608)- 10 -
(2) <strong>Consolidated</strong> Statements of IncomeHino Motors, Ltd. (7205) <strong>Financial</strong> <strong>Results</strong> for the Fiscal Year Ended March 31, 2008FY2007from April 1, 2006to March 31, 2007FY2008from April 1, 2007to March 31, 2008(millions of yen)Change fromthe prior yearAccountAmountPercentage(%)AmountPercentage(%)ChangeI. Net sales 1,287,668 100.0 1,368,633 100.0 80,965II. Cost of sales 1,105,994 85.9 1,172,976 85.7 66,982Gross profit on sales 181,674 14.1 195,656 14.3 13,982III. Selling, general andadministrative expenses1. Sales charges 8,173 10,2352. Freight, charges andstorage3. Provision of warrantyallowance10,105 12,15810,633 10,9354. Advertisement expenses 3,292 3,8795. Salary and benefits 38,679 39,3656. Provision of accruedbonuses7. Provision of accrueddirectors’ bonuses2,982 2,998370 5038. Retirement benefit cost 3,169 3,5459. Provision of accrueddirectors’ retirement- 717benefits10. Rent expenses 5,930 6,31211. Provision of allowance fordoubtful accounts- 78812. Others 61,635 144,972 11.2 58,326 149,767 10.9 4,795Operating income 36,701 2.9 45,889 3.4 9,187IV. Non-operating income1. Interest income 1,409 1,7932. Dividends income 1,822 1,2683. Gain on foreign exchange 684 -4. Rental income 659 3675. Investment gain on equitymethod1,219 8716. Other income 1,633 7,430 0.6 1,446 5,747 0.4 (1,682)V. Non-operating expenses1. Interest expenses 5,076 5,1062. Loss on foreign exchange - 2,9723. Other expenditure 2,214 7,290 0.6 2,523 10,602 0.8 3,311Ordinary income 36,841 2.9 41,035 3.0 4,193- 11 -
Hino Motors, Ltd. (7205) <strong>Financial</strong> <strong>Results</strong> for the Fiscal Year Ended March 31, 2008(millions of yen)FY2007from April 1, 2006to March 31, 2007FY2008from April 1, 2007to March 31, 2008Change fromthe prior yearAccountAmountPercentage(%)AmountPercentage(%)ChangeVI. Extraordinary income1. Gain on sale of fixedassets2. Gain on sale of investmentsecurities3. Reversal of allowance fordoubtful accounts4. OthersVII. Extraordinary losses1. Loss on sale or dispositionof fixed assets2. Provision of accrueddirectors’ retirementbenefits for prior years3. OthersNet income before incometaxes and minority interests577 1,264310 3562 -391 1,342 0.1 147 1,447 0.1 1051,793 1,861-2,4941,847 3,6400.31,241 5,5960.41,95634,542 2.7 36,885 2.7 2,342Income taxes 14,119 16,789Income taxes–deferred (678) 13,441 1.0 (3,713) 13,076 1.0 (364)Minority interests income ofconsolidated subsidiaries1,042 0.1 1,629 0.1 587Net income 20,059 1.6 22,178 1.6 2,119- 12 -
(3) <strong>Consolidated</strong> Statements of Changes in Shareholders’ EquityHino Motors, Ltd. (7205) <strong>Financial</strong> <strong>Results</strong> for the Fiscal Year Ended March 31, 2008For the fiscal year ended March 31, 2007 (from April 1, 2006 to March 31, 2007)Balance as of March 31, 2006(millions of yen)Change in items for theconsolidated fiscal yearCommon stockAdditional paid-incapitalShareholders’ equityRetained earningsTreasury stockTotalshareholders’equity72,717 64,307 105,702 (289) 242,437Cash dividends (Note 1) (5,167) (5,167)Bonus to directors (Note 2) (323) (323)Reversal of revaluation reservefor land(18) (18)Net income 20,059 20,059Acquisition of treasury stock (42) (42)Sale of treasury stock 2 1 3Change in scope of equitymethod(227) 5 (221)Change in non-equity items forthe fiscal year (net)Total change for the fiscal year(millions of yen) - 2 14,323 (35) 14,290Balance as of March 31, 2007(millions of yen)72,717 64,309 120,026 (325) 256,728Balance as of March 31, 2006(millions of yen)Change in items for theconsolidated fiscal yearUnrealizedgain (loss) onavailable-for-sale securitiesValuation and translation adjustmentsNet unrealizedgain on landrevaluationCumulativetranslationadjustmentTotalvaluation andtranslationadjustmentsMinorityinterestsTotal net assets37,006 1,529 (3,966) 34,568 15,164 292,170Cash dividends (Note 1) (5,167)Bonus to directors (Note 2) (323)Reversal of revaluation reservefor land(18)Net income 20,059Acquisition of treasury stock (42)Sale of treasury stock 3Change in scope of equitymethod(221)Change in non-equity items forthe consolidated fiscal year (net)(3,617) 18 1,744 (1,855) 1,358 (496)Total change for the fiscal year(millions of yen)(3,617) 18 1,744 (1,855) 1,358 13,793Balance as of March 31, 2007(millions of yen)33,388 1,547 (2,222) 32,713 16,522 305,964(Note 1) The figure includes appropriated earnings at the annual meeting of shareholders in June 2006, which amounts to ¥2,870 million.(Note 2) This is an item for appropriation of earnings at the annual meeting of shareholders in June 2006.- 13 -
Hino Motors, Ltd. (7205) <strong>Financial</strong> <strong>Results</strong> for the Fiscal Year Ended March 31, 2008For the fiscal year ended March 31, 2008 (from April 1, 2007 to March 31, 2008)Common stockAdditional paid-incapitalShareholders’ equityRetained earningsTreasury stockTotalshareholders’equityBalance as of March 31, 2007(millions of yen)72,717 64,309 120,026 (325) 256,728Change in items for theconsolidated fiscal yearCash dividends (5,740) (5,740)Reversal of revaluation reservefor land(70) (70)Net income 22,178 22,178Acquisition of treasury stock (56) (56)Sale of treasury stock 17 1 19Change in non-equity items forthe consolidated fiscal year (net)Total change for the fiscal year(millions of yen)Balance as of March 31, 2008(millions of yen)- 17 16,367 (54) 16,33072,717 64,327 136,393 (379) 273,058Unrealizedgain (loss) onavailable-for-sale securitiesValuation and translation adjustmentsNet unrealizedgain on landrevaluationCumulativetranslationadjustmentTotalvaluation andtranslationadjustmentsMinorityinterestsTotal net assetsBalance as of March 31, 2007(millions of yen)33,388 1,547 (2,222) 32,713 16,522 305,964Change in items for theconsolidated fiscal yearCash dividends (5,740)Reversal of revaluation reservefor land(70)Net income 22,178Acquisition of treasury stock (56)Sale of treasury stock 19Change in non-equity items forthe consolidated fiscal year (net)Total change for the fiscal year(millions of yen)Balance as of March 31, 2008(millions of yen)(11,449) 70 (3,092) (14,471) 935 (13,535)(11,449) 70 (3,092) (14,471) 935 2,79421,939 1,617 (5,315) 18,241 17,458 308,758- 14 -
Hino Motors, Ltd. (7205) <strong>Financial</strong> <strong>Results</strong> for the Fiscal Year Ended March 31, 2008(4) <strong>Consolidated</strong> Statements of Cash FlowsFY2007from April 1, 2006to March 31, 2007FY2008from April 1, 2007to March 31, 2008(millions of yen)Change fromthe prior yearAccount Amount Amount ChangeI. Cash flows from operatingactivities1. Net income before incometaxes and minority34,542 36,885interests2. Depreciation andamortization44,152 51,0023. Amortization of goodwill 100 814. Decrease in allowance fordoubtful accounts(393) (78)5. Increase in warrantyallowance2,900 3026. Increase in accruedemployees’ retirement364 507benefits7. Increase in accrueddirectors’ retirement- 2,800benefits8. Interest and dividendsincome(3,232) (3,062)9. Interest expenses 5,076 5,10610. Gain(loss) on foreignexchange300 (191)11. Investment gain on equitymethod(1,219) (871)12. Gain on sale of investmentsecurities(310) (35)13. Loss on sale or dispositionof fixed assets1,793 1,86114. Gain on sale of fixedassets(577) (1,264)15. Decrease in accountsreceivables8,771 20,70216. Increase (decrease) ininventories8,168 (13,045)17. Increase (decrease) inaccounts payables(5,181) 7,05918. Payment of directors’bonuses(323) -19. Others 5,117 (62)Subtotal 100,050 107,695 7,64420. Interest and dividendsreceived3,317 3,12421. Interest paid (4,386) (5,061)22. Income taxes paid (20,300) (13,253)Net cash flows fromoperating activities78,681 92,504 13,823- 15 -
Hino Motors, Ltd. (7205) <strong>Financial</strong> <strong>Results</strong> for the Fiscal Year Ended March 31, 2008(millions of yen)FY2007from April 1, 2006to March 31, 2007FY2008from April 1, 2007to March 31, 2008Change fromthe prior yearAccount Amount Amount ChangeII.Cash flows from investingactivities1. Payment into timedeposits2. Withdrawal of timedeposits3. Payments for acquisitionof tangible fixed assets4. Proceeds from sale oftangible fixed assets5. Payments for acquisitionof intangible fixed assets6. Payments for purchases ofinvestment securities7. Proceeds from sale ofinvestment securities8. Payments for foundationof affiliated companies(610) (246)374 591(50,975) (39,299)3,263 4,745(10,024) (10,327)(701) (321)724 69- (7,503)9. Payments for long-termloans receivable(149) (164)10. Proceeds from long-termloans receivable1,301 19711. Others (77) (10)Net cash flows frominvesting activities(56,873) (52,270) 4,603- 16 -
Hino Motors, Ltd. (7205) <strong>Financial</strong> <strong>Results</strong> for the Fiscal Year Ended March 31, 2008(millions of yen)FY2007from April 1, 2006to March 31, 2007FY2008from April 1, 2007to March 31, 2008Change fromthe prior yearAccount Amount Amount ChangeIII. Cash flows from financingactivities1. Net decrease in short-termloans payable(29,505) (18,217)2. Net decrease (increase) incommercial paper3. Proceeds from long-termloans payable4. Payments for repayment oflong-term loans payable5. Receipt from minorityshareholders2,000 (7,000)9,060 18,584(6,924) (27,079)- 5326. Dividends paid (5,167) (5,740)7. Others (26) (41)Net cash flows fromfinancing activitiesIV. Effect of exchange ratechanges on cash and cashequivalentsV. Increase (decrease) in cashand cash equivalentsVI. Cash and cash equivalents atbeginning of yearVII. Cash and cash equivalents atend of year(30,562) (38,963) (8,401)(181) (513) (331)(8,937) 756 9,69336,890 27,953 (8,937)27,953 28,710 756- 17 -
(5) Changes in Basis for Presenting <strong>Consolidated</strong> <strong>Financial</strong> Statements1. Depreciation Method for Tangible Fixed AssetsHino Motors, Ltd. (7205) <strong>Financial</strong> <strong>Results</strong> for the Fiscal Year Ended March 31, 2008(Change in accounting policies)Associated with the revision of the Corporation Tax law, the Company and its domestic consolidatedsubsidiaries have changed their depreciation method from the current consolidated fiscal year in orderto comply with the revised Corporation Tax Law in terms of the tangible fixed assets acquired on andafter April 1, 2007.As a result, operating income, ordinary income and net income before income taxes and minorityinterests respectively decreased by ¥999 million.(Additional information)In regard to the assets required on or before March 31, 2007, associated with the revision of theCorporation Tax Law, the Company and its domestic consolidated subsidiaries have adopted a methodof uniformly depreciating the difference between an amount equivalent to 5% of the acquisition costand the memorandum value for a five-year period, posting the result as part of depreciation expenses,from the consolidated fiscal year following the consolidated fiscal year where the acquisition cost hasreached 5% by the application of the Corporation Tax Law before the revision.As a result, operating income, ordinary income and net income before income taxes and minorityinterests respectively decreased by ¥1,933 million.2. Accrued Directors’ Retirement Benefits(Change in accounting policies)Although retirement benefits for directors of the Company and its domestic consolidated subsidiarieswere traditionally treated as expenses at the time of disbursement, a new method is being applied fromthe current consolidated fiscal year in order to post the payment at the end of the consolidated fiscalyear pursuant to the bylaws as accrued directors’ retirement benefits, in response to certain moves toinclude expense bonuses to directors as reserve allowances in accordance with the “AccountingStandards for Bonuses to Directors” in the <strong>Financial</strong> Accounting Standards No. 4 as well as the“Handling in Audits of Reserves under the Special Taxation Measures Law and Allowance or Reserveand Retirement Benefit Allowance for Directors under Special Laws” (JICPA Auditing and AssurancePractice Committee Statement No. 42, April 13, 2007).As a result, operating income and ordinary income respectively decreased by ¥717 million and netincome before income taxes and minority interests by ¥3,212 million.Except for the matters listed as 1 and 2 above, disclosure is omitted because there is no significantchange from contents of the recent securities report (submitted on June 26, 2007).- 18 -
Hino Motors, Ltd. (7205) <strong>Financial</strong> <strong>Results</strong> for the Fiscal Year Ended March 31, 2008(6) Notes to <strong>Consolidated</strong> <strong>Financial</strong> Statements(Segment Information)Overseas Net SalesFor the fiscal year ended March 31, 2007 (from April 1, 2006 to March 31, 2007)NorthLatinAsiaOceaniaAmericaAmericaOtherAreasI. Overseas net sales (millions of yen) 162,269 72,084 32,475 17,208 34,286 318,324II. <strong>Consolidated</strong> net sales (millions of yen) - - - - - 1,287,668III. Proportion of overseas net sales toconsolidated net sales (%)12.6 5.6 2.5 1.3 2.7 24.7(Note) 1. Segmentation of countries or regionsBased on geographical proximity2. Major countries or regions belonging to each categoryAsia: Thailand, Pakistan, Indonesia, China, etc.North America: The United States, CanadaOceania: Australia, New Zealand, etc.Latin America: Ecuador, Colombia, etc.Other Areas: Middle East, etc.TotalFor the fiscal year ended March 31, 2008 (from April 1, 2007 to March 31, 2008)NorthLatinAsiaOceaniaAmericaAmericaOtherAreasI. Overseas net sales (millions of yen) 229,624 82,770 44,008 29,851 57,745 443,999II. <strong>Consolidated</strong> net sales (millions of yen) - - - - - 1,368,633III. Proportion of overseas net sales toconsolidated net sales (%)(Note) 1. Segmentation of countries or regionsBased on geographical proximity2. Major countries or regions belonging to each categoryAsia: Thailand, Indonesia, Pakistan, China, etc.North America: The United States, CanadaOceania: Australia, New Zealand, etc.Latin America: Ecuador, Guatemala, etc.Other Areas World: Middle East, etc.Total16.8 6.0 3.2 2.2 4.2 32.4- 19 -
Hino Motors, Ltd. (7205) <strong>Financial</strong> <strong>Results</strong> for the Fiscal Year Ended March 31, 2008(Per Share Information)FY2007From April 1, 2006to March 31, 2007Net assets per share ¥504.36Net income per share ¥34.95Please note that diluted net income per share is not indicatedbecause there are no residual securities such as corporatebonds with equity warrants.FY2008From April 1, 2007to March 31, 2008Net assets per share ¥507.63Net income per share ¥38.65Same as on the left.(Note) Basis for the calculation of net income per share is as follows.FY2007From April 1, 2006to March 31, 2007FY2008From April 1, 2007to March 31, 2008Net income (millions of yen) 20,059 22,178Amount not attributable to common shareholders(millions of yen)--Net income associated with common shares(millions of yen)20,059 22,178Average number of shares (thousands of shares) 573,895 573,877(Significant Subsequent Events)Not applicable.(Omission of Disclosure)In regard to matters on lease transactions, transactions with related parties, tax effect accounting,securities, derivative transactions and retirement benefits, disclosure is omitted because the necessityof their disclosure in a financial results report is deemed not significant.- 20 -
6. Sales Breakdown (Non-<strong>Consolidated</strong>)(1) Actual Sales (Non-<strong>Consolidated</strong>)Hino Motors, Ltd. (7205) <strong>Financial</strong> <strong>Results</strong> for the Fiscal Year Ended March 31, 2008CategoryFY2007From April 1, 2006to March 31, 2007FY2008From April 1, 2007to March 31, 2008Change from the prior yearQuantity Value Quantity Value Quantity Value(in units) (millions of yen) (in units) (millions of yen) (in units) (millions of yen)Heavy-duty trucks 15,498 145,485 14,970 142,190 (528) (3,294)DomesticMedium-duty trucks 14,589 67,098 13,007 59,299 (1,582) (7,798)Total heavy- &medium-duty trucks30,087 212,583 27,977 201,490 (2,110) (11,092)Light-duty trucks 16,502 44,866 15,098 42,926 (1,404) (1,940)Buses 3,224 51,819 3,239 49,751 15 (2,067)Others - 9 - - - (9)Total 49,813 309,278 46,314 294,168 (3,499) (15,110)Total export 50,534 153,917 64,268 217,948 13,734 64,030Total trucks & buses 100,347 463,196 110,582 512,116 10,235 48,9204 Runner (Hilux Surf) 61,357 114,394 79,423 153,247 18,066 38,852Prado - - 93 165 93 165FJ Cruiser 84,773 153,706 69,730 129,627 (15,043) (24,079)Dyna series 56,585 80,615 51,218 72,065 (5,367) (8,550)High mobility vehicles 351 2,033 465 2,641 114 607Supplies and parts foroverseas production, etc. - 5,043 - 6,134 - 1,091Total commissioned vehicles 203,066 355,793 200,929 363,882 (2,137) 8,088Domestic 20,524 17,195 17,658 15,620 (2,866) (1,574)Export 4,351 4,370 10,468 8,347 6,117 3,977Total engines 24,875 21,565 28,126 23,968 3,251 2,402Domestic - 55,805 - 52,697 - (3,108)Export - 9,949 - 11,782 - 1,833Total supplies and parts - 65,755 - 64,480 - (1,274)Others - 70,372 - 69,708 - (664)Total net sales - 976,683 - 1,034,155 - 57,471(Net sales on export, which isincluded in total net sales)- (196,090) - (268,501) - (72,411)(Note) Values are rounded down to the nearest million yen.- 21 -
7. Non-<strong>Consolidated</strong> <strong>Financial</strong> StatementsHino Motors, Ltd. (7205) <strong>Financial</strong> <strong>Results</strong> for the Fiscal Year Ended March 31, 2008(1) Balance Sheets (millions of yen)FY2007March 31, 2007FY2008March 31, 2008Change fromthe prior yearAccountAmountComposition(%)AmountComposition(%)Change(Assets)I. Current assets1. Cash and deposits 5,371 2,8252. Trade notes 2,433 2,0043. Accounts receivable 180,537 172,9944. Finished goods 17,515 19,3775. Raw materials 219 2206. Work in progress 15,761 16,8977. Stores 2,858 2,8768. Prepaid expenses 367 2369. Deferred income taxes 9,318 10,21110. Accrued revenue 5,482 7,88811. Short-term loansreceivable20,370 35,95812. Others 950 65713. Allowance for doubtfulaccounts(292) (273)Total current assets 260,892 43.3 271,874 45.7 10,982II.Fixed assets(1) Tangible fixed assets1. Buildings 46,062 45,1322. Structures 8,942 8,6463. Machinery 54,973 60,4064. Vehicles andtransportation equipment3,035 2,7055. Tools and fixtures 11,436 9,1196. Lease assets 0 -7. Land 28,238 28,1988. Construction in progress 7,882 7,792Total tangible fixed assets 160,572 26.6 162,001 27.3 1,428- 22 -
Hino Motors, Ltd. (7205) <strong>Financial</strong> <strong>Results</strong> for the Fiscal Year Ended March 31, 2008(millions of yen)FY2007March 31, 2007FY2008March 31, 2008Change fromthe prior yearAccountAmountComposition(%)AmountComposition(%)Change(2) Intangible fixed assets1. Software 20,899 24,5412. Rights of facilityutilization1 13. Others 60 60Total intangible fixedassets(3) Investments and otherassets20,961 3.5 24,603 4.1 3,6421. Investment securities 68,602 50,1002. Stocks of affiliatedcompanies70,161 57,9283. Investments 2 24. Investments in affiliatedcompanies5. Long-term loansreceivable6. Long-term loansreceivable fromemployees7. Long-term loansreceivable fromaffiliated companies8. Long-overduereceivables9. Long-term prepaidexpenses2,110 10,3372 223 1218,236 16,7315,727 5,727670 58010. Others 1,020 97911. Allowance for doubtfulaccountsTotal investments andother assets(6,548) (6,563)160,008 26.6 135,837 22.9 (24,171)Total fixed assets 341,542 56.7 322,442 54.3 (19,099)Total assets 602,435 100.0 594,317 100.0 (8,117)(Liabilities)I. Current liabilities1. Notes payable 283 3232. Accounts payable–trade 122,232 128,1083. Short-term loans payable 1,000 15,5004. Commercial paper 39,000 32,0005. Current portion oflong-term loans payable2 16. Current portion oflong-term loans payable23,000 20,000to affiliated companies7. Other accounts payable 6,193 10,1158. Accrued expenses 26,238 25,5719. Accrued income taxes 2,998 5,880- 23 -
Hino Motors, Ltd. (7205) <strong>Financial</strong> <strong>Results</strong> for the Fiscal Year Ended March 31, 2008FY2007As of March 31, 2007FY2008As of March 31, 2008(millions of yen)Change fromthe prior yearAccountAmountComposition(%)AmountComposition(%)Change10. Advances by customers 128 12511. Deposits payable 1,222 4,02012. Accrued directors’bonuses160 20713. Warranty allowance 10,633 10,93514. Notes payable–facilities 2 8915. Others 18 19Total current liabilities 233,113 38.7 252,897 42.6 19,783II. Long-term liabilities1. Long-term loans payable 13 82. Long-term loans payableto affiliated companies38,766 31,7273. Deferred income taxes 14,115 2,4764. Accrued employees’retirement benefits18,657 19,3705. Accrued directors’retirement benefits - 790Total long-term liabilities 71,552 11.9 54,373 9.1 (17,179)Total liabilities 304,666 50.6 307,270 51.7 2,604- 24 -
Hino Motors, Ltd. (7205) <strong>Financial</strong> <strong>Results</strong> for the Fiscal Year Ended March 31, 2008(millions of yen)FY2007As of March 31, 2007FY2008As of March 31, 2008Change fromthe prior yearAccountAmountComposition(%)AmountComposition(%)Change(Net assets)I. Shareholders’ equity1. Common stock 72,717 12.0 72,717 12.2 -2. Additional paid-in capital(1) Capital reserves 64,307 64,307Total additional paid-incapital64,307 10.7 64,307 10.8 -3. Retained earnings(1) Legal reserve ofretained earnings7,103 7,103(2) Other retained earningsReserve for fixed assetreduction entry3,972 3,872General reserve 100,890 111,890Retained earningscarried forward20,778 8,606Total retained earnings 132,744 22.0 131,471 22.1 (1,272)4. Treasury stock (272) (0.0) (328) (0.0) (56)Total shareholders’equity269,496 44.7 268,167 45.1 (1,329)II. Valuation and translationadjustmentsUnrealized gain onavailable-for-sale28,271 18,879 (9,392)securitiesTotal valuation andtranslation28,271 4.7 18,879 3.2 (9,392)adjustmentsTotal net assets 297,768 49.4 287,046 48.3 (10,721)Total liabilities and netassets602,435 100.0 594,317 100.0 (8,117)- 25 -
Hino Motors, Ltd. (7205) <strong>Financial</strong> <strong>Results</strong> for the Fiscal Year Ended March 31, 2008(2) Non-<strong>Consolidated</strong> Statements of Income (millions of yen)FY2007from April 1, 2006to March 31, 2007FY2008from April 1, 2007to March 31, 2008Change fromthe prior yearAccountAmountPercentage(%)AmountPercentage(%)ChangeI. Net sales 976,683 100.0 1,034,155 100.0 57,471II. Cost of sales1. Opening inventory 17,327 17,5152. Cost of manufacturedgoods for the current year860,993 913,972Total 878,321 931,4873. Ending inventory 17,515 860,805 88.1 19,377 912,110 88.2 51,304Gross profit on sales 115,878 11.9 122,045 11.8 6,167III. Selling, general andadministrative expenses89,967 9.2 92,777 9.0 2,810Operating income 25,910 2.7 29,267 2.8 3,357IV. Non-operating income1. Interest income 1,331 2,0972. Dividends income 2,574 2,3153. Rental income 846 8714. Gain on foreign exchange 396 -5. Other income 392 5,540 0.5 316 5,601 0.6 60V. Non-operating expenses1. Interest expenses 848 9352. Depreciation andamortization3. Provision of allowancefor doubtful accounts572 607470 -4. Loss on foreign exchange - 3,4005. Contributions 72 4116. Other expenditure 829 2,793 0.3 754 6,109 0.6 3,316Ordinary income 28,658 2.9 28,759 2.8 100- 26 -
Hino Motors, Ltd. (7205) <strong>Financial</strong> <strong>Results</strong> for the Fiscal Year Ended March 31, 2008(millions of yen)FY2007from April 1, 2006to March 31, 2007FY2008from April 1, 2007to March 31, 2008Change fromthe prior yearAccountAmountPercentage(%)Amount Account ChangeVI. Extraordinary income1. Gain on sale of fixedassets2. Gain on sale ofinvestment securities52 70467 133. Others 4 523 0.1 3 87 0.0 (436)VII. Extraordinary losses1. Loss on sale ordisposition of fixed assets1,247 1,2942. Impairment loss on fixedassets1,845 13. Write-down of investmentsecurities16 64. Write-down of stocks ofaffiliated companies305 14,9325. Provision of accrueddirectors’ retirement- 572benefits for prior years6. Others 324 3,739 0.4 0 16,806 1.6 13,067Net income beforeincome taxesIncome taxes 9,437 10,74125,442 2.6 12,039 1.2 (13,403)Income taxes–deferred (495) 8,941 0.9 (3,169) 7,571 0.8 (1,369)Net income 16,501 1.7 4,467 0.4 (12,033)- 27 -
Hino Motors, Ltd. (7205) <strong>Financial</strong> <strong>Results</strong> for the Fiscal Year Ended March 31, 2008(3) Non-<strong>Consolidated</strong> Statements of Changes in Shareholders’ EquityFor the fiscal year ended March 31, 2007 (from April 1, 2006 to March 31, 2007)Shareholders’ equityBalance as of March 31, 2006(millions of yen)CommonstockAdditionalpaid-incapitalCapitalreservesLegalreserve ofretainedearningsReserve forfixed assetreductionentryRetained earningsOther retained earningsGeneralreserveRetainedearningscarriedforwardTotalretainedearningsTreasurystockTotalshareholders’equity72,717 64,307 7,103 4,198 84,890 25,396 121,588 (234) 258,378Change in items for the fiscal yearCash dividends (Note 1) (5,167) (5,167) (5,167)Bonus to directors (Note 2) (178) (178) (178)Reversal of reserve for fixed assetreduction entry (Note 1)(225) 225 - -General reserve (Note 2) 16,000 (16,000) - -Net income 16,501 16,501 16,501Acquisition of treasury stock (38) (38)Change in non-equity items forthe fiscal year (net)Total change for the fiscal year(millions of yen)Balance as of March 31, 2007(millions of yen)- - - (225) 16,000 (4,617) 11,156 (38) 11,11772,717 64,307 7,103 3,972 100,890 20,778 132,744 (272) 269,496Balance as of March 31, 2006(millions of yen)Valuation and translation adjustmentsUnrealized gain onavailable-for-salesecuritiesTotal valuationand translationadjustmentsTotal net assets31,804 31,804 290,183Change in items for the fiscal yearCash dividends (Note 1) (5,167)Bonus to directors (Note 2) (178)Reversal of reserve for fixed assetreduction entry (Note 1)General reserve (Note 2)--Net income 16,501Acquisition of treasury stock (38)Change in non-equity items forthe fiscal year (net)Total change for the fiscal year(millions of yen)Balance as of March 31, 2007(millions of yen)(3,532) (3,532) (3,532)(3,532) (3,532) 7,58528,271 28,271 297,768(Note 1) The figure includes appropriated earnings at the annual meeting of shareholders in June 2006, which consist of the cashdividends of ¥2,870 million and the reversal of reserve for fixed asset reduction entry of ¥117 million.(Note 2) This is an item for appropriation of earnings at the annual meeting of shareholders in June 2006.- 28 -
Hino Motors, Ltd. (7205) <strong>Financial</strong> <strong>Results</strong> for the Fiscal Year Ended March 31, 2008For the fiscal year ended March 31, 2008 (from April 1, 2007 to March 31, 2008)Shareholders’ equityBalance as of March 31, 2007(millions of yen)CommonstockAdditionalpaid-incapitalCapitalreservesLegalreserve ofretainedearningsReserve forfixed assetreductionentryRetained earningsOther retained earningsGeneralreserveRetainedearningscarriedforwardTotalretainedearningsTreasurystockTotalshareholders’equity72,717 64,307 7,103 3,972 100,890 20,778 132,744 (272) 269,496Change in items for the fiscal yearCash dividends (5,740) (5,740) (5,740)Reversal of reserve for fixed assetreduction entry(100) 100 - -General reserve 11,000 (11,000) - -Net income 4,467 4,467 4,467Acquisition of treasury stock (56) (56)Change in non-equity items forthe fiscal year (net)Total change for the fiscal year(millions of yen)Balance as of March 31, 2008(millions of yen)- - - (100) 11,000 (12,172) (1,272) (56) (1,329)72,717 64,307 7,103 3,872 111,890 8,606 131,471 (328) 268,167Balance as of March 31, 2007(millions of yen)Valuation and translation adjustmentsUnrealized gain onavailable-for-salesecuritiesTotal valuationand translationadjustmentsTotal net assets28,271 28,271 297,768Change in items for the fiscal yearCash dividends (5,740)Reversal of reserve for fixed assetreduction entryGeneral reserve--Net income 4,467Repurchase of stock (56)Change in non-equity items forthe fiscal year (net)Total change for the fiscal year(millions of yen)(9,392) (9,392) (9,392)(9,392) (9,392) (10,721)Balance as of March 31, 2008(millions of yen)18,879 18,879 287,046- 29 -
8. Changes in Directors and Statutory AuditorsHino Motors, Ltd. (7205) <strong>Financial</strong> <strong>Results</strong> for the Fiscal Year Ended March 31, 2008Candidate for New DirectorsSenior Managing Director, Member of the Board & Executive OfficerKenji Wagu [currently Senior Executive Officer]Senior Managing Director, Member of the Board & Executive OfficerAkimasa Yamamoto [currently Senior Executive Officer]Candidate for New Statutory AuditorStatutory AuditorHaruki Watari [currently Senior General Manager & General Manager of Human Resources Div]Resigning DirectorsTadaaki Jagawa [currently Chairman of the Board]Shinichiro Sugisaki [currently Executive Vice President, Member of the Board & Executive Officer]Bunji Hagiwara [currently Executive Vice President, Member of the Board & Executive Officer]Resigning Statutory AuditorAkira Senuma [currently Statutory Auditor]Planned Changes in Executive DirectorsChairman of the BoardShoji Kondo [currently President, Member of the Board & Executive Officer]President, Member of the Board & Executive OfficerYoshio Shirai [currently Executive Vice President, Member of the Board & Executive Officer]Executive Vice President, Member of the Board & Executive OfficerMasakazu Ichikawa [currently Senior Managing Director & Executive Officer]- 30 -
April 24, 2008Hino Motors, Ltd.Corporate Communications Dept.,Corporate Planning Div.<strong>Financial</strong> Reference for the Fiscal Year Ended March 31, 2008 (<strong>Consolidated</strong>)Prior Year Actual <strong>Results</strong> Current Year Actual <strong>Results</strong> Next Year Projected <strong>Results</strong>(FY ended March 2007) (FY ended March 2008) (FY ending March 2009)Year-on-yearrateYear-on-yearrateYear-on-yearrateUnit sales (Thousands of units) (Thousands of units) (Thousands of units)Domestic 51.4 -8.7% 45.8 -10.9% 44.9 -2.0%Overseas 50.9 10.9% 65.9 29.4% 78.5 19.2%Commissioned vehicles 203.1 7.6% 200.9 -1.1% 217.6 8.3%(billions of yen)(billions of yen)(billions of yen)Net sales 1,287.6 7.6% 1,368.6 6.3% 1,420.0 3.8%Domestic 579.4 -3.2% 530.5 -8.4% 538.0 1.4%Overseas 233.6 17.7% 315.5 35.0% 352.0 11.6%Toyota 474.6 18.8% 522.6 10.1% 530.0 1.4%(billions of yen)(billions of yen)(billions of yen)Operating income 36.7 -9.4% 45.9 25.0% 46.0 0.2%(Profit margin) (2.9%) (3.4%) (3.2%)(billions of yen)(billions of yen)(billions of yen)Ordinary income 36.8 -12.6% 41.0 11.4% 42.0 2.4%(Profit margin) (2.9%) (3.0%) (3.0%)(billions of yen)(billions of yen)(billions of yen)Net income 20.0 -30.1% 22.2 10.6% 22.0 -0.8%(Profit margin) (1.6%) (1.6%) (1.5%)(billions of yen) (billions of yen) (billions of yen)Variation factors (Based on operating income) Cost improvement 19.0 Sales efforts 8.2 Sales efforts 24.0Cost improvement 19.0 Cost improvement 19.0Change in environment 0.7 Change in business structur 1.2 Deterioration in environme 3.6 Change in environment 30.0Change in cost structure 8.5 Fluctuation in cost, etc. 14.4 Fluctuation in cost, etc. 12.9Deterioration in sales 12.4Total -3.8 Total 9.2 Total 0.1PerformanceIncreased revenue + Increased revenue + Increased revenue +evaluationdecreased profitincreased profitincreased profit(billions of yen)(billions of yen)(billions of yen)Capital expenditureHino MotorsSuppliersOverseasDealers48.324.95.713.64.1(billions of yen)43.729.64.37.22.6(billions of yen)68.043.010.58.06.5(billions of yen)DepreciationHino MotorsSuppliersOverseasDealers38.324.34.76.13.2(billions of yen)44.226.75.29.03.3(billions of yen)50.032.05.59.53.0(billions of yen)R&D34.4Exchange rate 117 yen/US$ 114 yen/US$ 100 yen/US$39.540.0
April 24, 2008Hino Motors, Ltd.Corporate Communications Dept.,Corporate Planning Div.<strong>Financial</strong> Reference for the Fiscal Year Ended March 31, 2008 (Non-<strong>Consolidated</strong>)Prior Year Actual <strong>Results</strong> Current Year Actual <strong>Results</strong> Next Year Projected <strong>Results</strong>(FY ended March 2007) (FY ended March 2008) (FY ending March 2009)Year-on-yearrateYear-on-year rateYear-on-year rateTotal demand of heavy- &(Thousands of units) (Thousands of units) (Thousands of units)medium-duty trucks105.4 -0.1% 85.1 -19.3% 80.0 -6.0%Heavy 57.5 3.3% 49.1 -14.7% 48.0 -2.3%Medium 47.9 -3.9% 36.0 -24.8% 32.0 -11.1%Total demand of light-duty trucks 120.8 3.2% 89.8 -25.7% 90.0 0.2%Registration of heavy- &(Thousands of units) (Thousands of units) (Thousands of units)medium-duty trucks32.8 -5.3% 27.6 -15.9% 26.4 -4.3%(Share - heavy & medium) (31.1%) (-1.7P) (32.4%) (1.3P) (33.0%) (0.6P)Heavy 17.6 -4.2% 14.8 -15.5% 15.1 1.8%(Share - heavy) (30.5%) (-2.4P) (30.2%) (-0.3P) (31.5%) (1.3P)Medium 15.2 -6.6% 12.8 -16.4% 11.3 -11.4%(Share - medium) (31.8%) (-0.9P) (35.4%) (3.6P) (35.4%) (0.0P)Registration of light-duty trucks 16.7 -6.1% 14.9 -10.3% 15.3 2.4%(Share - light) (13.8%) (-1.4P) (16.6%) (2.8P) (17.0%) (0.4P)(Thousands of units) (Thousands of units) (Thousands of units)Domestic productionTrucks & buses 99.5 -0.5% 110.3 10.8% 120.9 9.7%Commissioned vehicles 203.1 7.6% 200.9 -1.1% 217.6 8.3%(Thousands of units) (Thousands of units) (Thousands of units)ShipmentsDomestic 49.8 -14.0% 46.3 -7.0% 45.2 -2.4%Export 50.5 18.1% 64.3 27.2% 76.7 19.3%Commissioned vehicles 203.1 7.6% 200.9 -1.1% 217.6 8.3%Net sales 976.6 6.2% 1,034.2 5.9% 1,080.0 4.4%Domestic 390.6 -8.8% 371.6 -4.9% 374.0 0.7%Export 196.1 18.5% 268.5 36.9% 294.0 9.5%Toyota 389.9 19.6% 394.1 1.1% 412.0 4.5%Operating income 25.9 -25.8% 29.3 13.0% 26.0 -11.2%(Profit margin) (2.7%) (2.8%) (2.4%)(billions of yen)(billions of yen)(billions of yen)Ordinary income 28.6 -25.6% 28.8 0.4% 29.8 3.6%(Profit margin) (2.9%) (2.8%) (2.8%)(billions of yen)(billions of yen)(billions of yen)Net income 16.5 -24.2% 4.5 -72.9% 18.0 4.0 times(Profit margin) (1.7%) (0.4%) (1.7%)Performance evaluation(billions of yen) (billions of yen) (billions of yen)(billions of yen)Increased revenue +decreased profitCapital expenditure 24.9 (billions of yen) 29.6 (billions of yen) 43.0 (billions of yen)24.3Depreciation (billions of yen) (billions of yen) (billions of yen)34.0(billions of yen)Increased revenue +increased profitR&D (billions of yen) (billions of yen) (billions of yen)26.739.1(billions of yen)Increased revenue + decreasedprofit32.039.6