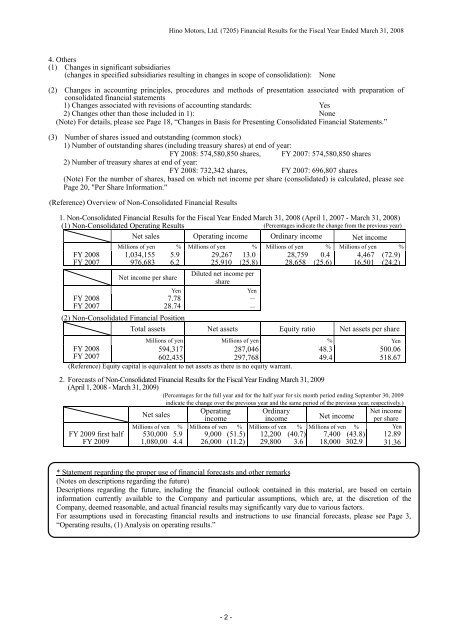
Hino Motors, Ltd. (7205) <strong>Financial</strong> <strong>Results</strong> for the Fiscal Year Ended March 31, 20084. Others(1) Changes in significant subsidiaries(changes in specified subsidiaries resulting in changes in scope of consolidation): None(2) Changes in accounting principles, procedures and methods of presentation associated with preparation ofconsolidated financial statements1) Changes associated with revisions of accounting standards: Yes2) Changes other than those included in 1): None(Note) For details, please see Page 18, “Changes in Basis for Presenting <strong>Consolidated</strong> <strong>Financial</strong> Statements.”(3) Number of shares issued and outstanding (common stock)1) Number of outstanding shares (including treasury shares) at end of year:FY 2008: 574,580,850 shares, FY 2007: 574,580,850 shares2) Number of treasury shares at end of year:FY 2008: 732,342 shares, FY 2007: 696,807 shares(Note) For the number of shares, based on which net income per share (consolidated) is calculated, please seePage 20, "Per Share Information."(Reference) Overview of Non-<strong>Consolidated</strong> <strong>Financial</strong> <strong>Results</strong>1. Non-<strong>Consolidated</strong> <strong>Financial</strong> <strong>Results</strong> for the Fiscal Year Ended March 31, 2008 (April 1, 2007 - March 31, 2008)(1) Non-<strong>Consolidated</strong> Operating <strong>Results</strong> (Percentages indicate the change from the previous year)Net sales Operating income Ordinary income Net incomeMillions of yen % Millions of yen % Millions of yen % Millions of yen %FY 2008FY 2007FY 2008FY 20071,034,155 5.9976,683 6.2Net income per shareYen7.7828.7429,267 13.025,910 (25.8)Diluted net income pershareYen--28,759 0.428,658 (25.6)4,467 (72.9)16,501 (24.2)(2) Non-<strong>Consolidated</strong> <strong>Financial</strong> PositionTotal assets Net assets Equity ratio Net assets per shareMillions of yen Millions of yen % YenFY 2008594,317287,046FY 2007602,435297,768(Reference) Equity capital is equivalent to net assets as there is no equity warrant.48.349.4500.06518.672. Forecasts of Non-<strong>Consolidated</strong> <strong>Financial</strong> <strong>Results</strong> for the Fiscal Year Ending March 31, 2009(April 1, 2008 - March 31, 2009)(Percentages for the full year and for the half year for six month period ending September 30, 2009FY 2009 first halfFY 2009indicate the change over the previous year and the same period of the previous year, respectively.)Net salesOperating OrdinaryNet incomeincomeincome Net income per shareMillions of yen % Millions of yen % Millions of yen % Millions of yen % Yen530,000 5.91,080,00 4.49,000 (51.5)26,000 (11.2)12,200 (40.7)29,800 3.67,400 (43.8)18,000 302.912.8931.36* Statement regarding the proper use of financial forecasts and other remarks(Notes on descriptions regarding the future)Descriptions regarding the future, including the financial outlook contained in this material, are based on certaininformation currently available to the Company and particular assumptions, which are, at the discretion of theCompany, deemed reasonable, and actual financial results may significantly vary due to various factors.For assumptions used in forecasting financial results and instructions to use financial forecasts, please see Page 3,“Operating results, (1) Analysis on operating results.”- 2 -
Hino Motors, Ltd. (7205) <strong>Financial</strong> <strong>Results</strong> for the Fiscal Year Ended March 31, 20081. Operating <strong>Results</strong>(1) Analysis of Operating <strong>Results</strong>1. Operating <strong>Results</strong> for the Fiscal Year Ended March 31, 2008During the consolidated fiscal year under review, Japan’s economy was on a trend for gradualexpansion, brought about by increase in corporate capital expenditure and exporting as well asrobust consumer spending despite the soaring costs of oil and raw materials. The <strong>global</strong>economy was generally strong as a high rate of growth was seen in emerging countries such asRussia, China, India and Middle Eastern nations, although some slowdown was observed inthe United States.For the market of domestic heavy- and medium-duty trucks, which were the Group’s flagshipproducts, total demand for the consolidated fiscal year under review decreased to 85,000 unitsby 20,000 units (19.3% down) from the previous year as the substitute demand, which hadbeen brought by control on exhaust emissions from diesel-powered vehicles since 2003,subsided in the second half of the previous year. Total demand in the light-duty truck marketalso fell by 31,000 units to 90,000 units (25.7% down) from the previous year.Affected by decreased demand, domestic unit sales decreased by 6,000 units to 46,000 units(10.9% down) from the previous year as the total of heavy-, medium- and light-duty trucksand buses.Overseas unit sales of trucks and buses, on the other hand, significantly increased from theprevious year due to rising demand in Asia, Latin America and Middle Eastern regions. As aresult, record-high sales of 66,000 units were achieved, increasing by 15,000 units (29.4% up)from the prior year.Accordingly, total unit sales of Hino-branded trucks and buses amounted to 112,000 units,growing by 9,000 units (9.1% up) from the previous year.As for vehicle production commissioned by Toyota Motor Corporation, total production was201,000 units, decreasing by 2,000 units (1.1% down) from the previous year. This wasbecause production of the FJ Cruiser mainly for the U.S. market dropped, although Hilux Surffor export increased in its production. In March 2008, production of the Land Cruiser Pradostarted. The commissioned part supply service for Toyota-branded vehicles in overseassubsidiaries showed favorable performance, backed by received orders of suspension-relatedparts for new models in the United States<strong>Consolidated</strong> net sales for the consolidated fiscal year under review amounted to ¥1,368,633million, rising by ¥80,965 million (6.3% up) from the previous year because of increase in unitsales of Hino-branded vehicles in foreign markets and favorable business in the commissionedpart supply service of overseas subsidiaries. Increases in overseas unit sales, revenue growth inoverseas subsidiaries and promotion of cost reduction brought about remarkable results: theconsolidated operating income of ¥45,889 million, increasing by ¥9,187 million (25.0% up)from the previous year; the consolidated ordinary income of ¥41,035 million, growing by¥4,193 million (11.4% up) and consolidated net income of ¥22,178 million, rising by ¥2,119million (10.6% up) from the prior year. Net sales and operating income hit all-time high.- 3 -
- Page 1: Financial Results for the Fiscal Ye
- Page 5 and 6: Hino Motors, Ltd. (7205) Financial
- Page 7 and 8: Hino Motors, Ltd. (7205) Financial
- Page 9 and 10: Hino Motors, Ltd. (7205) Financial
- Page 11 and 12: (2) Consolidated Statements of Inco
- Page 13 and 14: (3) Consolidated Statements of Chan
- Page 15 and 16: Hino Motors, Ltd. (7205) Financial
- Page 17 and 18: Hino Motors, Ltd. (7205) Financial
- Page 19 and 20: Hino Motors, Ltd. (7205) Financial
- Page 21 and 22: 6. Sales Breakdown (Non-Consolidate
- Page 23 and 24: Hino Motors, Ltd. (7205) Financial
- Page 25 and 26: Hino Motors, Ltd. (7205) Financial
- Page 27 and 28: Hino Motors, Ltd. (7205) Financial
- Page 29 and 30: Hino Motors, Ltd. (7205) Financial
- Page 31 and 32: April 24, 2008Hino Motors, Ltd.Corp