download the PDF - JP Morgan Asset Management
download the PDF - JP Morgan Asset Management
download the PDF - JP Morgan Asset Management

Create successful ePaper yourself
Turn your PDF publications into a flip-book with our unique Google optimized e-Paper software.
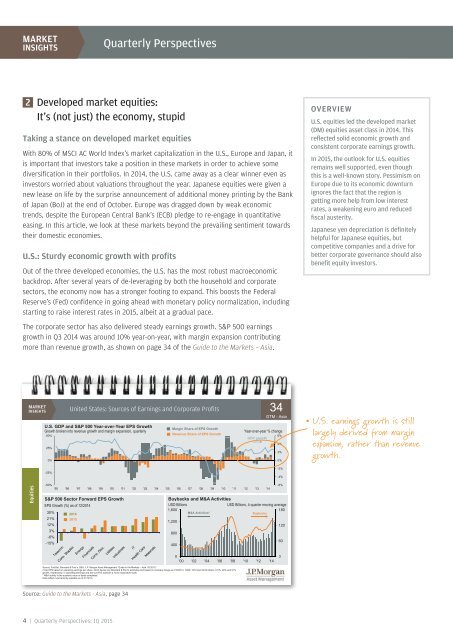
MARKETINSIGHTSQuarterly Perspectives2 Developed market equities:It’s (not just) <strong>the</strong> economy, stupidTaking a stance on developed market equitiesWith 80% of MSCI AC World Index’s market capitalization in <strong>the</strong> U.S., Europe and Japan, itis important that investors take a position in <strong>the</strong>se markets in order to achieve somediversification in <strong>the</strong>ir portfolios. In 2014, <strong>the</strong> U.S. came away as a clear winner even asinvestors worried about valuations throughout <strong>the</strong> year. Japanese equities were given anew lease on life by <strong>the</strong> surprise announcement of additional money printing by <strong>the</strong> Bankof Japan (BoJ) at <strong>the</strong> end of October. Europe was dragged down by weak economictrends, despite <strong>the</strong> European Central Bank’s (ECB) pledge to re-engage in quantitativeeasing. In this article, we look at <strong>the</strong>se markets beyond <strong>the</strong> prevailing sentiment towards<strong>the</strong>ir domestic economies.U.S.: Sturdy economic growth with profitsOut of <strong>the</strong> three developed economies, <strong>the</strong> U.S. has <strong>the</strong> most robust macroeconomicbackdrop. After several years of de-leveraging by both <strong>the</strong> household and corporatesectors, <strong>the</strong> economy now has a stronger footing to expand. This boosts <strong>the</strong> FederalReserve’s (Fed) confidence in going ahead with monetary policy normalization, includingstarting to raise interest rates in 2015, albeit at a gradual pace.The corporate sector has also delivered steady earnings growth. S&P 500 earningsgrowth in Q3 2014 was around 10% year-on-year, with margin expansion contributingmore than revenue growth, as shown on page 34 of <strong>the</strong> Guide to <strong>the</strong> Markets – Asia.OVERVIEWU.S. equities led <strong>the</strong> developed market(DM) equities asset class in 2014. Thisreflected solid economic growth andconsistent corporate earnings growth.In 2015, <strong>the</strong> outlook for U.S. equitiesremains well supported, even thoughthis is a well-known story. Pessimism onEurope due to its economic downturnignores <strong>the</strong> fact that <strong>the</strong> region isgetting more help from low interestrates, a weakening euro and reducedfiscal austerity.Japanese yen depreciation is definitelyhelpful for Japanese equities, butcompetitive companies and a drive forbetter corporate governance should alsobenefit equity investors.United States: Sources of Earnings and Corporate ProfitsU.S. GDP and S&P 500 Year-over-Year EPS GrowthGrowth broken into revenue growth and margin expansion, quarterly50%25%0%Margin Share of EPS GrowthRevenue Share of EPS Growth34GTM - AsiaClickYear-over-year % changeGDP growth6%4%2%0%U.S. earnings growth is stilllargely derived from marginexpansion, ra<strong>the</strong>r than revenuegrowth.-25%-2%-4%Eq quities-50%-6%'95 '96 '97 '98 '99 '00 '01 '02 '03 '04 '05 '06 '07 '08 '09 '10 '11 '12 '13 '14S&P 500 Sector Forward EPS GrowthBuybacks and M&A ActivitiesEPS Growth (%) as of 12/2014USD BillionsUSD Billions, 4-quarter moving average1,60018030% 2014M&A Activities*Buybacks21% 20151,20012%1203%800-6%60-15%4000'00 '02 '04 '06 '08 '10 '12 '140Source: FactSet, Standard & Poor’s, BEA, J.P. <strong>Morgan</strong> <strong>Asset</strong> <strong>Management</strong> “Guide to <strong>the</strong> Markets – Asia 1Q 2015.”(Top) EPS based on operating earnings per share. 2Q14 figures are Standard & Poor’s estimates and based on company filings as of 30/6/14. 1Q09, 1010 and 2Q10 reflect -101%, 92% and 51%growth, respectively, in operating earnings and are cut off to maintain a more reasonable scale.* M&A activity is <strong>the</strong> quarterly value of deals completed.Data reflect most recently available as of 31/12/14.Source: Guide to <strong>the</strong> Markets - Asia, page 344 | Quarterly Perspectives: 1Q 2015