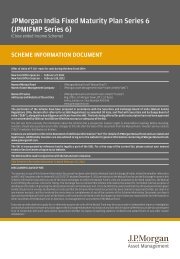
MARKETINSIGHTSQuarterly PerspectivesJapan: Looking beyond <strong>the</strong> weak yenWhile <strong>the</strong> BoJ’s additional asset purchases have driven <strong>the</strong> Japanese yen lower andJapanese equities higher, this is not <strong>the</strong> only reason for investing in Japanese equities.Admittedly, <strong>the</strong>re are many long-term structural issues troubling <strong>the</strong> Japaneseeconomy, including demographics, fiscal sustainability and structural competitiveness.None<strong>the</strong>less, we still see some interesting opportunities in Japanese equities.Despite Japan’s struggle to regain growth momentum and shrug off disinflation,Japanese companies have experienced strong earnings growth. Earnings revisions havebeen favorable in <strong>the</strong> past 18 months, as shown in <strong>the</strong> top chart on page 32 of <strong>the</strong>Guide to <strong>the</strong> Markets – Asia. Return on equity (ROE) and profit margins have alsoimproved. While investors may attribute this to a weak yen, this neglects <strong>the</strong> fact that<strong>the</strong>re are some globally competitive companies in technology and robotics, above andbeyond some of <strong>the</strong> household names in automobiles and consumer electronics.The change in <strong>the</strong> USD 1.2trn asset allocation of <strong>the</strong> Government Pension InvestmentFund (GPIF) in favor of local equities will also help, but this is a long-term adjustmentinstead of a near term boost. The push for better corporate governance, includingproviding shareholders with a better return on equity, could be more critical to <strong>the</strong>long-term outlook for Japanese equities amid economic malaise.INVESTMENT IMPLICATIONSU.S. equities seem to be an obviouschoice for investors in <strong>the</strong> developedmarket equity asset class, given <strong>the</strong>economic outlook and good corporateearnings performance.We believe that European and Japaneseequities can also benefit from domesticfactors even though headline growth ismediocre. Pessimism on Europe neglectssome of <strong>the</strong> downside protection that<strong>the</strong> central bank is providing. For Japan,a weak yen is a great help to corporateprofits, but a drive to improve corporategovernance also deserves some credit.Global Earnings MomentumGlobal Equities Earnings MomentumEarnings Revision (Upward Revision – Downward Revision / Total Revision), 3-month moving average0.40.20.0-0.232GTM - AsiaClickEarnings Revision Since Jan 2013Latest 3 ObservationsJapanese companies have enjoyedpositive earnings revisions in<strong>the</strong> past 18 months, withimprovement in ROE and netmargins.Eq quities-0.4S&P 500 TOPIX Europe Asia ex-<strong>JP</strong> EMForward Return on Equity (%)Global Net Margins (%)20%Net income / sales16%12%8%4%Asia ex-JapanJapanEuropeU.S.EM12%10%8%6%4%2%0%JapanEMEuropeU.S.Asia ex-Japan0%'07 '08 '09 '10 '11 '12 '13 '14 '15-2%'07 '08 '09 '10 '11 '12 '13 '14 '15Source: S&P, MSCI, FactSet, J.P. <strong>Morgan</strong> <strong>Asset</strong> <strong>Management</strong> “Guide to <strong>the</strong> Markets – Asia 1Q 2015.”(Top) Earnings revision is calculated by taking <strong>the</strong> difference between <strong>the</strong> number of analyst upgrades and analyst downgrades, divided by <strong>the</strong> totalnumber of analyst revisions on a monthly basis. Earnings revision above 0 would mean that <strong>the</strong>re were more upgrade revisions than downgraderevisions. Data reflect most recently available as of 31/12/14.Source: Guide to <strong>the</strong> Markets - Asia, page 326 | Quarterly Perspectives: 1Q 2015
3 Emerging markets: Hard dollar, soft oilInvestment trends in emerging markets amid strong dollarand low oil pricesA strong U.S. dollar and weak oil prices were two important <strong>the</strong>mes surrounding emergingmarkets at <strong>the</strong> end of 2014. Many investors fear that a strong U.S. dollar and <strong>the</strong> FederalReserve’s normalization could triggered financial crisis in emerging markets, similar tothose in <strong>the</strong> 1990s. Meanwhile, a sharp drop in oil prices could also undermine oilproducers, especially Russia and <strong>the</strong> Middle East, as well as hurt broader commodityproducers. We recognize that some emerging markets are vulnerable in this environment,but differentiation is going to be key to capturing investment opportunities.Page 60 of <strong>the</strong> Guide to <strong>the</strong> Markets-Asia shows <strong>the</strong> dollar index, USD movements againsta trade weighted basket of currencies. This shows that, despite <strong>the</strong> surge in <strong>the</strong> USDagainst <strong>the</strong> Japanese yen and euro in 2014, <strong>the</strong> current USD index is still only at <strong>the</strong> top of<strong>the</strong> range for <strong>the</strong> past 10 years, and potentially still has some way to go before beingconsidered overvalued. This USD strength is partly driven by favorable interest ratedifferentials, as well as improvement in <strong>the</strong> U.S. current account position.It is important to recognize that not all emerging markets are equal in a strong dollarenvironment. Many of <strong>the</strong> Asian economies have experienced less currency depreciationsince <strong>the</strong> dollar index hit bottom in 2011. Countries with strong current accounts that areless dependent on commodities should be more resilient in this environment.OVERVIEWEmerging markets (EM) will need toface <strong>the</strong> prospects of fur<strong>the</strong>r U.S. dollar(USD) streng<strong>the</strong>ning and possiblefur<strong>the</strong>r downward pressure on oilprices. Since each emerging economy isunique in its external payment positionand exposure to oil, differentiation iskey.USD strength has been a headwindhistorically for emerging markets. Thosecountries with external imbalances arelikely to require more adjustments torestore balance, which could put shorttermpressure on market performance.While all emerging markets benefitfrom low inflation brought on by low oilprices, oil importers have an advantageover exporters.O<strong>the</strong>r <strong>Asset</strong>s andnvestor Beha viorIU.S. Dollar Exchange RateU.S. Dollar PerformanceIndex130120110U.S. DollarIndex (DXY)1009080Real Trade Weighted70Exchange Rate Index(REER)60'86 '88 '90 '92 '94 '96 '98 '00 '02 '04 '06 '08 '10 '12 '14U.S. Current Account BalanceUSD billions50 Value % of GDP 2%00%-50-2%-100-4%-150-200-6%-250-8%'86 '88 '90 '92 '94 '96 '98 '00 '02 '04 '06 '08 '10 '12 '14ChinaKoreaPhilippinesUKSingaporeThailandTaiwanMalaysiaCanadaEuropeMexicoAustraliaIndiaIndonesiaJapanClickCurrency Performance vs. USD% since <strong>the</strong> beginning of <strong>the</strong> USD uptrend in April 2011TurkeyBrazilSouth AfricaArgentinaRussiaAsian CountriesO<strong>the</strong>r EM CountriesDM Countries-51.8%-54.4%-40.8%-43.1%-30.0%-30.9%-32.3%-35.0%-25.2%-6.5%-7.8%-9.3% 93%-9.4%-15.3%-18.1%-18.4%-21.8%-3.2%-4.3%60GTM - Asia46% 4.6%-70% -50% -30% -10% 10%There are significant differencesamongst <strong>the</strong> performance of EMcurrencies since <strong>the</strong> USD hitbottom in 2011.Source: Federal Reserve, U.S. Bureau of Economic Analysis, Reuters, FactSet, J.P. <strong>Morgan</strong> <strong>Asset</strong> <strong>Management</strong> “Guide to <strong>the</strong> Markets – Asia 1Q 2015.”(Top Left) The Real Trade Weighted Exchange Rate Index is <strong>the</strong> weighted average of a country’s currency relative to a basket of o<strong>the</strong>r major currencies adjusted for <strong>the</strong>effects of inflation. The weights are determined by comparing <strong>the</strong> relative trade balances, in terms of one country’s currency, with o<strong>the</strong>r countries within <strong>the</strong> basket. TheDollar Index is a trade-weighted index calculated using six major world currencies. Data reflect most recently available as of 31/12/14.Source: Guide to <strong>the</strong> Markets - Asia, page 60J.P. <strong>Morgan</strong> <strong>Asset</strong> <strong>Management</strong> | 7