download the PDF - JP Morgan Asset Management
download the PDF - JP Morgan Asset Management
download the PDF - JP Morgan Asset Management

You also want an ePaper? Increase the reach of your titles
YUMPU automatically turns print PDFs into web optimized ePapers that Google loves.
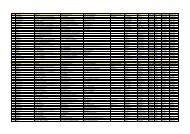
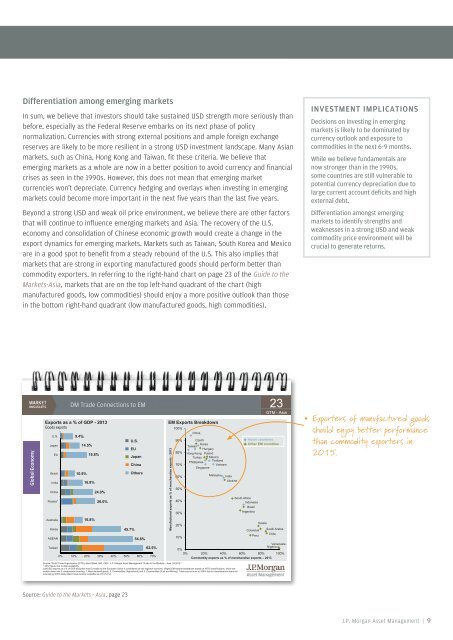
Differentiation among emerging marketsIn sum, we believe that investors should take sustained USD strength more seriously thanbefore, especially as <strong>the</strong> Federal Reserve embarks on its next phase of policynormalization. Currencies with strong external positions and ample foreign exchangereserves are likely to be more resilient in a strong USD investment landscape. Many Asianmarkets, such as China, Hong Kong and Taiwan, fit <strong>the</strong>se criteria. We believe thatemerging markets as a whole are now in a better position to avoid currency and financialcrises as seen in <strong>the</strong> 1990s. However, this does not mean that emerging marketcurrencies won’t depreciate. Currency hedging and overlays when investing in emergingmarkets could become more important in <strong>the</strong> next five years than <strong>the</strong> last five years.Beyond a strong USD and weak oil price environment, we believe <strong>the</strong>re are o<strong>the</strong>r factorsthat will continue to influence emerging markets and Asia. The recovery of <strong>the</strong> U.S.economy and consolidation of Chinese economic growth would create a change in <strong>the</strong>export dynamics for emerging markets. Markets such as Taiwan, South Korea and Mexicoare in a good spot to benefit from a steady rebound of <strong>the</strong> U.S. This also implies thatmarkets that are strong in exporting manufactured goods should perform better thancommodity exporters. In referring to <strong>the</strong> right-hand chart on page 23 of <strong>the</strong> Guide to <strong>the</strong>Markets-Asia, markets that are on <strong>the</strong> top left-hand quadrant of <strong>the</strong> chart (highmanufactured goods, low commodities) should enjoy a more positive outlook than thosein <strong>the</strong> bottom right-hand quadrant (low manufactured goods, high commodities).INVESTMENT IMPLICATIONSDecisions on investing in emergingmarkets is likely to be dominated bycurrency outlook and exposure tocommodities in <strong>the</strong> next 6-9 months.While we believe fundamentals arenow stronger than in <strong>the</strong> 1990s,some countries are still vulnerable topotential currency depreciation due tolarge current account deficits and highexternal debt.Differentiation amongst emergingmarkets to identify strengths andweaknesses in a strong USD and weakcommodity price environment will becrucial to generate returns.conomyGlobal EcU.S.DM Trade Connections to EMExports as a % of GDP - 2013Goods exportsJapan9.4%14.5%EU 19.8%BrazilIndiaChina10.9%16.8%24.0%U.S.EUJapanChinaO<strong>the</strong>rsEM Exports Breakdown100%China% of merchandise ex xports - 2013Click23GTM - Asia90% CzechAsian countriesKoreaO<strong>the</strong>r EM countriesTaiwanHungary80% Hong Kong PolandTurkey MexicoThailandPhilippines70%VietnamSingaporeMalaysia60%IndiaUkraine50%Exporters of manufactured goodsshould enjoy better performancethan commodity exporters in2015.Russia*AustraliaKoreaASEANTaiwan16.8%26.0%45.7%54.6%62.5%0% 10% 20% 30% 40% 50% 60% 70%Manu ufactured exports asSouth Africa40%IndonesiaBrazilArgentina30%Russia20%ColombiaSaudi ArabiaChilePeru10%VenezuelaNigeria0%0% 20% 40% 60% 80% 100%Commodity exports as % of merchandise exports – 2013Source: World Trade Organization (WTO), World Bank, IMF, CEIC, J.P. <strong>Morgan</strong> <strong>Asset</strong> <strong>Management</strong> “Guide to <strong>the</strong> Markets – Asia 1Q 2015.”* 2012 figure due to data availability.(Left) EU exports as a % of GDP excludes intra EU-trade as <strong>the</strong> European Union is considered as one regional economy. (Right) EM exports breakdown based on WTO classifications, which arebroken down into 3 components including: 1. Manufactured goods, 2. Commodities (Agricultural) and 3. Commodities (Fuel and Mining). Total may not sum to 100% due to miscellaneous items notcovered by WTO. Data reflect most recently available as of 31/12/14.Source: Guide to <strong>the</strong> Markets - Asia, page 23J.P. <strong>Morgan</strong> <strong>Asset</strong> <strong>Management</strong> | 9