48 Managing Systems of Secondary Citiescontain 75 per cent of the world’s urban population. In both developing and industrializedcountries, average densities of cities have been declining rapidly, which Angel estimatesat an annual rate of 1.7 per cent over the last decade in developing countries, and of 2.2 percent in industrialized countries (Angel et al., 2005:1-2). Urban density is falling at morethan 3 per cent per year in some Asian countries (Roberts and Kanaley, 2006).The continuation of this form of development is unsustainable and will have asignificant impact on the logistics, economic efficiencies and cost of running citiesin the future. The continuation of the current conversion of land to urban useaccording to a United Nations report (UN, 2012) would result in the land occupiedby cities having 100,000 people or more, increasing by a factor of 2.75 by 2030. Thereport estimates that if the current patterns of urban settlement continue, every newresident in developing countries will convert, on average, some 160 square kilometresof non-urban land to urban land during this period. This would require more than175,000 square kilometres of land conversion by 2025.While the fall in density is a concern about the efficiency and performance of cities,secondary cities have the highest falls in urban density and rates of growth in urbanfootprints appear to be highest. Urban population densities between megacities andsecondary cities can vary significantly. For example, the urban density in Mumbai,India, fell from 466 persons per hectare (pph) to 436 pph between 1990 and 2000 (0.7per cent per annum), while urban density in Hyderabad, a secondary city of 5.7 million(2000), fell from 282 pph to 180 pph (-3.7%) over the same period. Overall, the rate ofgrowth in urban areas and fall in density in secondary cities appear one to two timesthat of major urban centres. This has important implications for the resource planning,efficiency and competitiveness of secondary cities.There are significant differences between the percentage growth in urban area,populations and change in density in the regions between primate and secondary cities.Latin American cities have relatively stable rates of growth and density change. InChinese, Indian and African cities, rates of urban sprawl and the fall in urban densityis high in both primate and secondary cities (Table 3.6). Primacy shown in the Table isthe ratio of the size of a secondary population to the largest city in the country.3.4.1 Spatial Distortions in Economies of Secondary CitiesCities contribute between 75 and 80 per cent of global Gross Domestic Product (GDP).The McKinsey Global Cities report estimated that the world’s largest and middle-ordercities, representing 22 per cent of the global population or around 45 per cent of urbanpopulation, contributed to about 60 per cent to global GDP (Cadena, 2011). Most ofthese cities have populations of more than 500,000 people. On this basis rural areas,smaller urban cities and settlements, and smaller secondary cities produce less than20 per cent of global GDP. Thus around 70-75 per cent of the world’s population aredependent on 25 mainly regional cities and towns for many of their basic needs. The
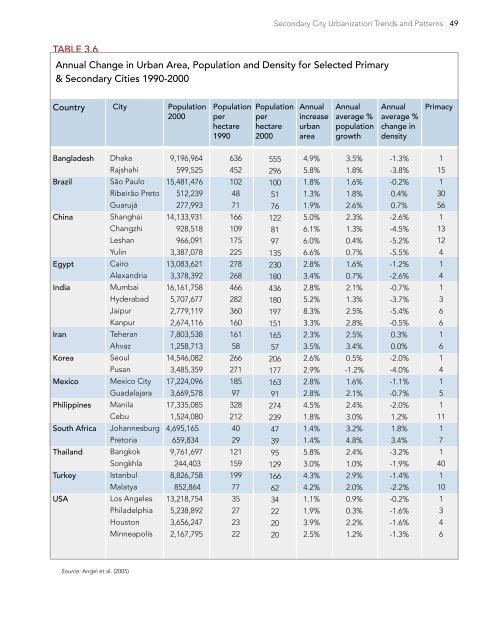
Secondary City Urbanization Trends and Patterns 49Table 3.6Annual Change in Urban Area, Population and Density for Selected Primary& Secondary Cities 1990-2000CountryCityPopulation2000Populationperhectare1990Populationperhectare2000AnnualincreaseurbanareaAnnualaverage %populationgrowthAnnualaverage %change indensityPrimacyBangladeshBrazilChinaEgyptIndiaIranKoreaMexicoPhilippinesSouth AfricaThailandTurkeyUSADhakaRajshahiSão PauloRibeirão PretoGuarujáShanghaiChangzhiLeshanYulinCairoAlexandriaMumbaiHyderabadJaipurKanpurTeheranAhvazSeoulPusanMexico CityGuadalajaraManilaCebuJohannesburgPretoriaBangkokSongkhlaIstanbulMalatyaLos AngelesPhiladelphiaHoustonMinneapolis9,196,964599,52515,481,476512,239277,99314,133,931928,518966,0913,387,07813,083,6213,378,39216,161,7585,707,6772,779,1192,674,1167,803,5381,258,71314,546,0823,485,35917,224,0963,669,57817,335,0851,524,0804,695,165659,8349,761,697244,4038,826,758852,86413,218,7545,238,8923,656,2472,167,795636452102487116610917522527826846628236016016158266271185973282124029121159199773527232255529610051761228197135230180436180197151165572061771639127423947399512916662342220204.9%5.8%1.8%1.3%1.9%5.0%6.1%6.0%6.6%2.8%3.4%2.8%5.2%8.3%3.3%2.3%3.5%2.6%2.9%2.8%2.8%4.5%1.8%1.4%1.4%5.8%3.0%4.3%4.2%1.1%1.9%3.9%2.5%3.5%1.8%1.6%1.8%2.6%2.3%1.3%0.4%0.7%1.6%0.7%2.1%1.3%2.5%2.8%2.5%3.4%0.5%-1.2%1.6%2.1%2.4%3.0%3.2%4.8%2.4%1.0%2.9%2.0%0.9%0.3%2.2%1.2%-1.3%-3.8%-0.2%0.4%0.7%-2.6%-4.5%-5.2%-5.5%-1.2%-2.6%-0.7%-3.7%-5.4%-0.5%0.3%0.0%-2.0%-4.0%-1.1%-0.7%-2.0%1.2%1.8%3.4%-3.2%-1.9%-1.4%-2.2%-0.2%-1.6%-1.6%-1.3%11513056113124141366161415111171401101346Source: Angel et al. (2005)