Internal Service Funds - Virginia Department of Accounts
Internal Service Funds - Virginia Department of Accounts
Internal Service Funds - Virginia Department of Accounts

You also want an ePaper? Increase the reach of your titles
YUMPU automatically turns print PDFs into web optimized ePapers that Google loves.
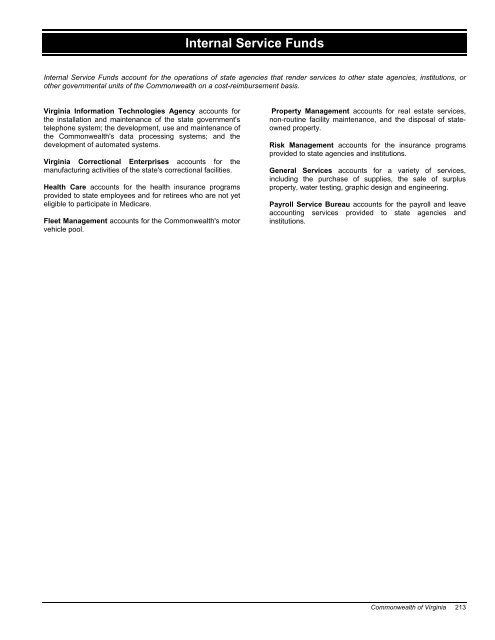
<strong>Internal</strong> <strong>Service</strong> <strong>Funds</strong><strong>Internal</strong> <strong>Service</strong> <strong>Funds</strong> account for the operations <strong>of</strong> state agencies that render services to other state agencies, institutions, orother governmental units <strong>of</strong> the Commonwealth on a cost-reimbursement basis.<strong>Virginia</strong> Information Technologies Agency accounts forthe installation and maintenance <strong>of</strong> the state government'stelephone system; the development, use and maintenance <strong>of</strong>the Commonwealth's data processing systems; and thedevelopment <strong>of</strong> automated systems.<strong>Virginia</strong> Correctional Enterprises accounts for themanufacturing activities <strong>of</strong> the state's correctional facilities.Health Care accounts for the health insurance programsprovided to state employees and for retirees who are not yeteligible to participate in Medicare.Fleet Management accounts for the Commonwealth's motorvehicle pool.Property Management accounts for real estate services,non-routine facility maintenance, and the disposal <strong>of</strong> stateownedproperty.Risk Management accounts for the insurance programsprovided to state agencies and institutions.General <strong>Service</strong>s accounts for a variety <strong>of</strong> services,including the purchase <strong>of</strong> supplies, the sale <strong>of</strong> surplusproperty, water testing, graphic design and engineering.Payroll <strong>Service</strong> Bureau accounts for the payroll and leaveaccounting services provided to state agencies andinstitutions.Commonwealth <strong>of</strong> <strong>Virginia</strong> 213
Combining Statement <strong>of</strong> Net Assets – <strong>Internal</strong> <strong>Service</strong> <strong>Funds</strong>June 30, 2010(Dollars in Thousands)<strong>Virginia</strong>InformationTechnologiesAgency<strong>Virginia</strong>CorrectionalEnterprisesHealth CareAssetsCurrent Assets:Cash and Cash Equivalents $ 33,908 $ 6,706 $ 258,534Investments - - 22,339Receivables, Net 2,904 4,670 9,893Due From Other <strong>Funds</strong> 13,692 1,394 19,981Due From External Parties (Fiduciary <strong>Funds</strong>) - - 121Due From Component Units - - 11,802Inventory - 10,961 -Prepaid Items - - -Other Assets 7,678 3 -Total Current Assets 58,182 23,734 322,670Noncurrent Assets:Nondepreciable Capital Assets - 278 -Depreciable Capital Assets, Net 3,098 8,279 -Total Noncurrent Assets 3,098 8,557 -Total Assets 61,280 32,291 322,670LiabilitiesCurrent Liabilities:<strong>Accounts</strong> Payable 34,632 1,460 19,415Amounts Due to Other Governments - - -Due to Other <strong>Funds</strong> 110 121 -Due to External Parties (Fiduciary <strong>Funds</strong>) 322 139 -Interfund Payable 30,000 - -Unearned Revenue 20,294 711 -Obligations Under Securities Lending Program - - 63,788Other Liabilities - 1 -Claims Payable Due Within One Year - - 94,376Long-term Liabilities Due within One Year 767 47 -Total Current Liabilities 86,125 2,479 177,579Noncurrent Liabilities:Interfund Payable - - -Claims Payable Due In More Than One Year - - -Long-term Liabilities Due in More Than One Year 10,246 4,035 -Total Noncurrent Liabilities 10,246 4,035 -Total Liabilities 96,371 6,514 177,579Net AssetsInvested in Capital Assets, Net <strong>of</strong> Related Debt 3,098 8,557 -Unrestricted (38,189) 17,220 145,091Total Net Assets (Deficit) $ (35,091) $ 25,777 $ 145,091214 Commonwealth <strong>of</strong> <strong>Virginia</strong>
FleetPropertyRiskManagement Management ManagementGeneral<strong>Service</strong>sPayroll<strong>Service</strong>BureauTotal$ 3,870 $ 18,715 $ 162,802 $ 6,499 $ 246 $ 491,280- - 13,881 - - 36,220211 449 364 1,244 - 19,735501 1,908 - 632 1 38,109- - - - - 121- - - - - 11,80240 315 - 3,998 - 15,314- 5 40 - 105 150- - 100 1 - 7,7824,622 21,392 177,187 12,374 352 620,513- - - 150 - 42820,389 14,107 - 7,949 - 53,82220,389 14,107 - 8,099 - 54,25025,011 35,499 177,187 20,473 352 674,763447 1,830 1,531 824 65 60,204- 717 - - - 71797 838 2 294 6 1,46812 142 6 82 18 721- 220 - 1,264 - 31,484326 13,759 47,707 16 - 82,813- - 39,638 - - 103,426- 298 757 52 - 1,108- - 65,046 - - 159,4221,195 3,653 28 358 96 6,1442,077 21,457 154,715 2,890 185 447,507- 4,614 - 4,426 - 9,040- - 379,421 - - 379,4211,284 20,565 473 1,987 466 39,0561,284 25,179 379,894 6,413 466 427,5173,361 46,636 534,609 9,303 651 875,02418,289 (5,922) - 8,099 - 32,1213,361 (5,215) (357,422) 3,071 (299) (232,382)$ 21,650 $ (11,137) $ (357,422) $ 11,170 $ (299) $ (200,261)Commonwealth <strong>of</strong> <strong>Virginia</strong> 215
Combining Statement <strong>of</strong> Revenues, Expenses, and Changes in Fund Net Assets –<strong>Internal</strong> <strong>Service</strong> <strong>Funds</strong>For the Fiscal Year Ended June 30, 2010(Dollars in Thousands)<strong>Virginia</strong>InformationTechnologiesAgency<strong>Virginia</strong>CorrectionalEnterprisesHealth CareOperating RevenuesCharges for Sales and <strong>Service</strong>s $ 253,323 $ 48,193 $ 939,319Total Operating Revenues 253,323 48,193 939,319Operating ExpensesCost <strong>of</strong> Sales and <strong>Service</strong>s - 37,047 -Prizes and Claims - - 895,979Personal <strong>Service</strong>s 28,433 5,212 -Contractual <strong>Service</strong>s 252,961 2,721 61,813Supplies and Materials 146 432 -Depreciation 3,212 1,125 -Rent, Insurance, and Other Related Charges 3,231 1,145 -Interest Expense - - -Other 2,809 436 -Total Operating Expenses 290,792 48,118 957,792Operating Income (Loss) (37,469) 75 (18,473)Nonoperating Revenues (Expenses)Interest, Dividends, Rents, and Other Investment Income - - 1,965Other (18) 20 (76)Total Nonoperating Revenues (Expenses) (18) 20 1,889Income (Loss) Before Transfers (37,487) 95 (16,584)Transfers In - - -Transfers Out (149) (2,575) (2,100)Change in Net Assets (37,636) (2,480) (18,684)Total Net Assets (Deficit), July 1 2,545 28,257 163,775Total Net Assets (Deficit), June 30 $ (35,091) $ 25,777 $ 145,091216 Commonwealth <strong>of</strong> <strong>Virginia</strong>
FleetManagementPropertyManagementRiskManagementGeneral<strong>Service</strong>sPayroll<strong>Service</strong>BureauTotal$ 11,833 $ 100,157 $ 92,743 $ 40,211 $ 1,758 $ 1,487,53711,833 100,157 92,743 40,211 1,758 1,487,537- - - 26,943 - 63,990- - 103,430 - - 999,409988 11,723 1,570 6,254 2,002 56,1823,105 12,057 9,355 3,546 3 345,5613,580 3,798 3 788 43 8,7904,911 2,635 - 779 - 12,662645 59,363 1,860 1,707 - 67,951- 55 - 119 - 174253 6,196 6,552 118 - 16,36413,482 95,827 122,770 40,254 2,048 1,571,083(1,649) 4,330 (30,027) (43) (290) (83,546)- - 1,093 157 - 3,215(457) (3,164) (42) (3) - (3,740)(457) (3,164) 1,051 154 - (525)(2,106) 1,166 (28,976) 111 (290) (84,071)- - - 330 - 330(152) (164) - (15) (9) (5,164)(2,258) 1,002 (28,976) 426 (299) (88,905)23,908 (12,139) (328,446) 10,744 - (111,356)$ 21,650 $ (11,137) $ (357,422) $ 11,170 $ (299) $ (200,261)Commonwealth <strong>of</strong> <strong>Virginia</strong> 217
Combining Statement <strong>of</strong> Cash Flows – <strong>Internal</strong> <strong>Service</strong> <strong>Funds</strong>For the Fiscal Year Ended June 30, 2010(Dollars in Thousands)<strong>Virginia</strong>InformationTechnologiesAgency<strong>Virginia</strong>CorrectionalEnterprisesHealth CareCash Flows from Operating ActivitiesReceipts for Sales and <strong>Service</strong>s $ 13,977 $ 23,663 $ 940,862<strong>Internal</strong> Activity-Receipts from Other <strong>Funds</strong> 247,212 24,733 -<strong>Internal</strong> Activity-Payments to Other <strong>Funds</strong> (695) (1,727) -Payments to Suppliers for Goods and <strong>Service</strong>s (5,326) (35,437) -Payments for Contractual <strong>Service</strong>s (251,082) (2,643) (62,555)Payments for Prizes, Claims, and Loss Control - - (929,221)Payments to Employees (27,833) (4,360) -Other Operating Expense - (353) -Net Cash Provided by (Used for) Operating Activities (23,747) 3,876 (50,914)Cash Flows from Noncapital Financing ActivitiesTransfers In From Other <strong>Funds</strong> - - -Transfers Out to Other <strong>Funds</strong> (149) (2,575) (2,100)Other Noncapital Financing Receipt Activities 30,000 - -Net Cash Provided by (Used for) Noncapital Financing Activities 29,851 (2,575) (2,100)Cash Flows from Capital and Related Financing ActivitiesAcquisition <strong>of</strong> Capital Assets (697) (1,833) -Payment <strong>of</strong> Principal and Interest on Bonds and Notes - - -Proceeds from Sale <strong>of</strong> Capital Assets - 11 -Net Cash Provided By (Used for) Capital and RelatedFinancing Activities (697) (1,822) -Cash Flows from Investing ActivitiesInvestment Income on Cash, Cash Equivalents, and Investments - - 1,889Net Cash Provided by (Used for) Investing Activities - - 1,889Net Increase (Decrease) in Cash and Cash Equivalents 5,407 (521) (51,125)Cash and Cash Equivalents, July 1 28,501 7,230 268,210Cash and Cash Equivalents, June 30 $ 33,908 $ 6,709 $ 217,085Reconciliation <strong>of</strong> Cash and Cash EquivalentsPer the Statement <strong>of</strong> Net Assets:Cash and Cash Equivalents $ 33,908 $ 6,706 $ 258,534Cash and Travel Advances - 3 -Less:Securities Lending Cash Equivalents - - (41,449)Cash and Cash Equivalents per the Statement <strong>of</strong> Cash Flows $ 33,908 $ 6,709 $ 217,085218 Commonwealth <strong>of</strong> <strong>Virginia</strong>
FleetManagementPropertyManagementRiskManagementGeneral<strong>Service</strong>sPayroll<strong>Service</strong>BureauTotal$ 1,832 $ 5,690 $ 32,271 $ 12,639 $ 35 $ 1,030,96910,193 97,703 65,173 27,621 1,723 474,358(2,206) (3,313) - (2,924) - (10,865)(3,305) (64,976) (3) (27,528) (43) (136,618)(2,232) (11,841) (9,318) (2,596) - (342,267)- - (72,358) - - (1,001,579)(928) (10,722) (1,409) (6,112) (1,352) (52,716)(223) (2,044) (8,403) - (108) (11,131)3,131 10,497 5,953 1,100 255 (49,849)- - - 330 - 330(152) (164) - (15) (9) (5,164)- - - 209 - 30,209(152) (164) - 524 (9) 25,375(764) (91) - (33) - (3,418)(1,124) (6,182) - (5) - (7,311)412 - - - - 423(1,476) (6,273) - (38) - (10,306)- - 1,051 - - 2,940- - 1,051 - - 2,9401,503 4,060 7,004 1,586 246 (31,840)2,367 14,655 130,142 4,914 - 456,019$ 3,870 $ 18,715 $ 137,146 $ 6,500 $ 246 $ 424,179$ 3,870 $ 18,715 $ 162,802 $ 6,499 $ 246 $ 491,280- - 100 1 - 104- - (25,756) - - (67,205)$ 3,870 $ 18,715 $ 137,146 $ 6,500 $ 246 $ 424,179Continued on next pageCommonwealth <strong>of</strong> <strong>Virginia</strong> 219
Combining Statement <strong>of</strong> Cash Flows – <strong>Internal</strong> <strong>Service</strong> <strong>Funds</strong> (Continued from previous page)For the Fiscal Year Ended June 30, 2010(Dollars in Thousands)<strong>Virginia</strong>InformationTechnologiesAgency<strong>Virginia</strong>CorrectionalEnterprisesHealth CareReconciliation <strong>of</strong> Operating IncomeTo Net Cash Provided by (Used for)Operating Activities:Operating Income (Loss) $ (37,469) $ 75 $ (18,473)Adjustments to Reconcile OperatingIncome to Net Cash Provided by (Used for)Operating Activities:Depreciation 3,212 1,125 -Miscellaneous Nonoperating Income - 53 -Other Expenses - 39 -Change in Assets and Liabilities:(Increase) Decrease in <strong>Accounts</strong> Receivable 79 (1,415) 10,794(Increase) Decrease in Due From Other <strong>Funds</strong> (393) 1,269 735(Increase) Decrease in Due From External Parties (Fiduciary <strong>Funds</strong>) - - (121)(Increase) Decrease in Due From Component Units - - (11,802)(Increase) Decrease in Other Assets 1,819 - -(Increase) Decrease in Inventory - 822 -(Increase) Decrease in Prepaid Items - 160 -Increase (Decrease) in <strong>Accounts</strong> Payable 1,487 555 (21,512)Increase (Decrease) in Amounts Due to Other Governments - - -Increase (Decrease) in Due to Other <strong>Funds</strong> (67) 50 -Increase (Decrease) in Due to External Parties (Fiduciary <strong>Funds</strong>) 322 139 -Increase (Decrease) in Interfund Payable - - -Increase (Decrease) in Unearned Revenue 6,361 99 -Increase (Decrease) in Other Liabilities - 1 -Increase (Decrease) in Claims Payable: Due Within One Year - - (10,535)Increase (Decrease) in Claims Payable: Due in More Than One Year - - -Increase (Decrease) in Long-term Liabilities: Due Within One Year (412) 38 -Increase (Decrease) in Long-term Liabilities: Due in More Than One Year 1,314 866 -Net Cash Provided by (Used for) Operating Activities $ (23,747) $ 3,876 $ (50,914)Noncash Investing, Capital, and Financing Activities:The following transactions occurred prior to the statement <strong>of</strong> net assets date:New Capital Leases $ - $ - $ -Trade-ins <strong>of</strong> Used Equipment on New Equipment - 40 -Installment Purchases Used to Finance Capital Assets - - -Capital Asset Addition Included in <strong>Accounts</strong> Payable 160 - -Total Noncash, Investing, Capital, and Financing Activities $ 160 $ 40 $ -220 Commonwealth <strong>of</strong> <strong>Virginia</strong>
FleetManagementPropertyManagementRiskManagementGeneral<strong>Service</strong>sPayroll<strong>Service</strong>BureauTotal$ (1,649) $ 4,330 $ (30,027) $ (43) $ (290) $ (83,546)4,911 2,635 - 779 - 12,662- - - - - 53- - - - - 39(39) 86 10 (3) - 9,512(59) 589 - 118 (1) 2,258- - - - - (121)- - - - - (11,802)- - - - - 1,819(16) 36 - (149) - 693- (5) (1) 272 (105) 321(429) (871) 258 (242) 65 (20,689)- (133) - - - (133)37 278 2 141 6 44712 142 6 82 18 721- (220) - - - (220)301 2,648 4,691 (13) - 14,087- 48 (4,523) - - (4,474)- - 2,717 - - (7,818)- - 32,694 - - 32,6941 26 1 (38) 96 (288)61 908 125 196 466 3,936$ 3,131 $ 10,497 $ 5,953 $ 1,100 $ 255 $ (49,849)$ - $ 4,037 $ - $ - $ - $ 4,037- - - - - 40765 - - - - 765- 63 - - - 223$ 765 $ 4,100 $ - $ - $ - $ 5,065Commonwealth <strong>of</strong> <strong>Virginia</strong> 221