Union certification: Developing a level playing field ... - LabourWatch
Union certification: Developing a level playing field ... - LabourWatch
Union certification: Developing a level playing field ... - LabourWatch

You also want an ePaper? Increase the reach of your titles
YUMPU automatically turns print PDFs into web optimized ePapers that Google loves.
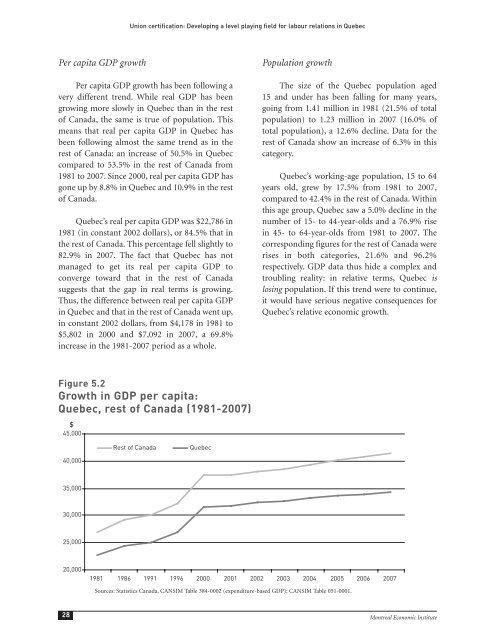
<strong>Union</strong> <strong>certification</strong>: <strong>Developing</strong> a <strong>level</strong> <strong>playing</strong> <strong>field</strong> for labour relations in QuebecPer capita GDP growthPer capita GDP growth has been following avery different trend. While real GDP has beengrowing more slowly in Quebec than in the restof Canada, the same is true of population. Thismeans that real per capita GDP in Quebec hasbeen following almost the same trend as in therest of Canada: an increase of 50.5% in Quebeccompared to 53.5% in the rest of Canada from1981 to 2007. Since 2000, real per capita GDP hasgone up by 8.8% in Quebec and 10.9% in the restof Canada.Quebec’s real per capita GDP was $22,786 in1981 (in constant 2002 dollars), or 84.5% that inthe rest of Canada. This percentage fell slightly to82.9% in 2007. The fact that Quebec has notmanaged to get its real per capita GDP toconverge toward that in the rest of Canadasuggests that the gap in real terms is growing.Thus, the difference between real per capita GDPin Quebec and that in the rest of Canada went up,in constant 2002 dollars, from $4,178 in 1981 to$5,802 in 2000 and $7,092 in 2007, a 69.8%increase in the 1981-2007 period as a whole.Population growthThe size of the Quebec population aged15 and under has been falling for many years,going from 1.41 million in 1981 (21.5% of totalpopulation) to 1.23 million in 2007 (16.0% oftotal population), a 12.6% decline. Data for therest of Canada show an increase of 6.3% in thiscategory.Quebec’s working-age population, 15 to 64years old, grew by 17.5% from 1981 to 2007,compared to 42.4% in the rest of Canada. Withinthis age group, Quebec saw a 5.0% decline in thenumber of 15- to 44-year-olds and a 76.9% risein 45- to 64-year-olds from 1981 to 2007. Thecorresponding figures for the rest of Canada wererises in both categories, 21.6% and 96.2%respectively. GDP data thus hide a complex andtroubling reality: in relative terms, Quebec islosing population. If this trend were to continue,it would have serious negative consequences forQuebec’s relative economic growth.Figure 5.2Growth in GDP per capita:Quebec, rest of Canada (1981-2007)$45,000Rest of CanadaQuebec40,00035,00030,00025,00020,0001981 1986 1991 1996 2000 2001 2002 2003 2004 2005 2006 2007Sources: Statistics Canada, CANSIM Table 384-0002 (expenditure-based GDP); CANSIM Table 051-0001.28 Montreal Economic Institute