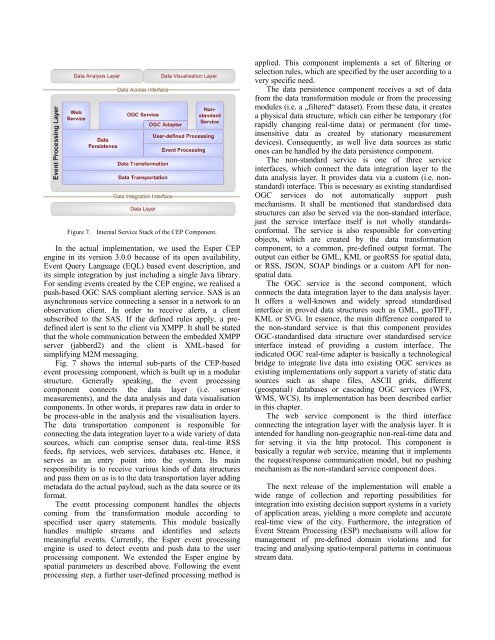
Figure 7. Internal Service Stack of the CEP Component.In the actual implementation, we used the Esper CEPengine in its version 3.0.0 because of its open availability,Event Query Language (EQL) based event description, andits simple integration by just including a single Java library.For sending events created by the CEP engine, we realised apush-based OGC SAS compliant alerting service. SAS is anasynchronous service connecting a sensor in a network to anobservation client. In order to receive alerts, a clientsubscribed to the SAS. If the defined rules apply, a predefinedalert is sent to the client via XMPP. It shall be statedthat the whole communication between the embedded XMPPserver (jabberd2) and the client is XML-based <strong>for</strong>simplifying M2M messaging.Fig. 7 shows the internal sub-parts of the CEP-basedevent processing component, which is built up in a modularstructure. Generally speaking, the event processingcomponent connects the data layer (i.e. sensormeasurements), and the data analysis and data visualisationcomponents. In other words, it prepares raw data in order tobe process-able in the analysis and the visualisation layers.The data transportation component is responsible <strong>for</strong>connecting the data integration layer to a wide variety of datasources, which can comprise sensor data, real-time RSSfeeds, ftp services, web services, databases etc. Hence, itserves as an entry point into the system. Its mainresponsibility is to receive various kinds of data structuresand pass them on as is to the data transportation layer addingmetadata do the actual payload, such as the data source or its<strong>for</strong>mat.The event processing component handles the objectscoming from the trans<strong>for</strong>mation module according tospecified user query statements. This module basicallyhandles multiple streams and identifies and selectsmeaningful events. Currently, the Esper event processingengine is used to detect events and push data to the userprocessing component. We extended the Esper engine byspatial parameters as described above. Following the eventprocessing step, a further user-defined processing method isapplied. This component implements a set of filtering orselection rules, which are specified by the user according to avery specific need.The data persistence component receives a set of datafrom the data trans<strong>for</strong>mation module or from the processingmodules (i.e. a „filtered“ dataset). From these data, it createsa physical data structure, which can either be temporary (<strong>for</strong>rapidly changing real-time data) or permanent (<strong>for</strong> timeinsensitivedata as created by stationary measurementdevices). Consequently, as well live data sources as staticones can be handled by the data persistence component.The non-standard service is one of three serviceinterfaces, which connect the data integration layer to thedata analysis layer. It provides data via a custom (i.e. nonstandard)interface. This is necessary as existing standardisedOGC services do not automatically support pushmechanisms. It shall be mentioned that standardised datastructures can also be served via the non-standard interface,just the service interface itself is not wholly standardscon<strong>for</strong>mal.The service is also responsible <strong>for</strong> convertingobjects, which are created by the data trans<strong>for</strong>mationcomponent, to a common, pre-defined output <strong>for</strong>mat. Theoutput can either be GML, KML or geoRSS <strong>for</strong> spatial data,or RSS, JSON, SOAP bindings or a custom API <strong>for</strong> nonspatialdata.The OGC service is the second component, whichconnects the data integration layer to the data analysis layer.It offers a well-known and widely spread standardisedinterface in proved data structures such as GML, geoTIFF,KML or SVG. In essence, the main difference compared tothe non-standard service is that this component providesOGC-standardised data structure over standardised serviceinterface instead of providing a custom interface. Theindicated OGC real-time adapter is basically a technologicalbridge to integrate live data into existing OGC services asexisting implementations only support a variety of static datasources such as shape files, ASCII grids, different(geospatial) databases or cascading OGC services (WFS,WMS, WCS). Its implementation has been described earlierin this chapter.The web service component is the third interfaceconnecting the integration layer with the analysis layer. It isintended <strong>for</strong> handling non-geographic non-real-time data and<strong>for</strong> serving it via the http protocol. This component isbasically a regular web service, meaning that it implementsthe request/response communication model, but no pushingmechanism as the non-standard service component does.The next release of the implementation will enable awide range of collection and reporting possibilities <strong>for</strong>integration into existing decision support systems in a varietyof application areas, yielding a more complete and accuratereal-time view of the city. Furthermore, the integration ofEvent Stream Processing (ESP) mechanisms will allow <strong>for</strong>management of pre-defined domain violations and <strong>for</strong>tracing and analysing spatio-temporal patterns in continuousstream data.
VI. EFFECTS ON THE URBAN CONTEXTFrom a socio-political viewpoint, Live Geography isprimarily targeted at the in<strong>for</strong>mation needs of local andregional governments. It enables them to respond to theenvironmental and social challenges of the city and to learnmore about the impacts of urban policies and practices.Moreover, it also supports professionals, such as urban andtransportation planners, in building or refining their modelsof urban dynamics. In fact, it can change the work ofpractitioners that was previously about predicting andaccommodating, and which is now becoming moreobserving and improving. Indeed, this new ability to renderall kinds of „machine readable“ environments not onlyprovide new views on the city and its environment, but alsosupply urban and transportation engineers and planners withindicators to evaluate their interventions. For instance, DanHill and Duncan Wilson <strong>for</strong>esee the ability to tune buildingsand cities through pre and post occupancy evaluations. Theyspeculate that the future of environmental in<strong>for</strong>mation willbe part of the fabric of buildings [20]. However, thisintegration opens all sorts of issues regarding sampling,density, standardisation, quality control, power control,access to data, and update frequency.A complete picture might be hard to achieve withincomplete environmental data patched together by datamining, filtering and visualisation algorithms. <strong>Environmental</strong>monitoring in the urban context is limited to classic technicalissues related to data resolution and heterogeneity. Evenmobile sensors do not yet provide high-density samplingcoverage over a wide area, limiting research to sense what istechnically possible to sense with economical and socialconstraints. One set of solutions rely on the calibration ofmathematical models with only a few sensors nodes andcomplementing data sources to create a set of spatialindicators. Another, approach aims at revealing instead ofhiding the incompleteness of the data. Visualising theuncertainty of spatial data is a recurrent theme in cartographyand in<strong>for</strong>mation visualisation [21]. These visualisationtechniques present data in such a manner that users are madeaware of the degree of uncertainty so as to allow <strong>for</strong> morein<strong>for</strong>med analyses and decisions. It is a strategy to promotethe user appropriation of the in<strong>for</strong>mation with an awarenessof its limitations [22]. Without these strategies to handle thefluctuating quality of the data, their partial coverage couldimpact people’s perception of the environment, by providinga quasi-objective but inaccurate angle of the content, andpotentially „negatively“ influencing their behaviour.Another way to improve the coverage of environmentdata is to alter the current model whereby civic governmentwould act as sole data-gatherer and decision-maker byempowering everyday citizen to monitor the environmentwith sensor-enabled mobile devices. Recently providers ofgeographic and urban data have learned the value of peoplecentricsensing to improve their services and from theactivities of their customers. For instance the body ofknowledge on a city’s road conditions and real-time roadtraffic network in<strong>for</strong>mation thrive on the crowd-sourcing ofgeo-data the owners of TomTom system and mobile phoneoperators customers generate. Similarly, the users of GoogleMyMaps have contributed, without their awareness, to theproduction the massive database necessary <strong>for</strong> thedevelopment of the location-based version of the application.However, this people-centric approach to gather data raiselegitimate privacy, data integrity and accuracy concerns.These issues can be handled with a mix of policy definition,local processing, verification and privacy preserving datamining techniques [23]. These technical solutions necessitatea richer discussion beyond the academic domain on theseobserving technologies’ social implications.Similar crowd-sourcing strategies have been considered<strong>for</strong> environmental monitoring with individuals acting assensor nodes and coming together with other people in orderto <strong>for</strong>m sensor networks. Several research projects explore awide range of novel physical sensors attached to mobiledevices empowering everyday non-experts to collect andshare air quality data measured with sensor-enabled mobiledevices. For instance, Ergo [24] is a simple SMS system thatallows anyone with a mobile phone to quickly and easilyexplore, query, and learn about local air quality on-the-gowith their mobile phone. With these tools, citizens augmenttheir role, becoming agents of change by uncovering,visualising, and sharing real-time air quality measurementsfrom their own everyday urban life. This „citizen science“approach [25] creates value in<strong>for</strong>mation <strong>for</strong> researchers ofdata generated by people going on their daily life, oftenbased on explicit and participatory sensing actions. Byturning mobile phones [26], watches [27] or bikes [28] intosensing devices, the researchers hope that publicunderstandings of science and environmental issues will beimproved and can have access to larger and more detaileddata sets. This access to environmental data of the city alsobecomes a tool to raise the citizen awareness of the state ofthe environment.These data gathering possibilities also imply that we areat the end of the ephemeral; in some ways we will be able toreplay the city. In contrast we are also ahead of conflicts toreveal or hide unwanted evidences, when new data can beused to the detriment of some stakeholder and policy makers.Indeed, the capacity to collect and disseminate reconfiguresensor data influence political networks, focussing onenvironmental data as products or objects that can be used<strong>for</strong> future political action. There<strong>for</strong>e, openness, quality, trustand confidence in the data will also be subject of debate (e.g.bias to have people record their observations, who gets toreport data and who not). This people-centric view ofmeasuring, sharing, and discussing our environment mightincrease agencies’ and decision makers’ understanding of acommunity’s claims, potentially increasing public trust in thein<strong>for</strong>mation provided by a Live Geography approach.This raises a real challenge: how can we encourage,promote and motivate environmentally sustainablebehaviours on the basis of Live Geography in<strong>for</strong>mation?Recent work [29] shows how real-time in<strong>for</strong>mation aboutcities and their patterns of use, visualised in new ways, andmade available locally on-demand in ways that people canact upon, may make an important contribution tosustainability. However, the communication of data collected