English - Siegfried
English - Siegfried
English - Siegfried

You also want an ePaper? Increase the reach of your titles
YUMPU automatically turns print PDFs into web optimized ePapers that Google loves.
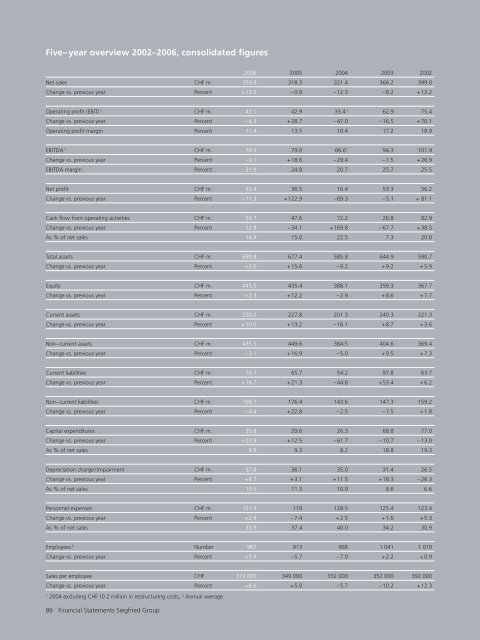
Five– year overview 2002–2006, consolidated figures2006 2005 2004 2003 2002Net sales CHF m. 359.8 318.3 321.4 366.2 399.0Change vs. previous year Percent +13.0 – 0.9 – 12.3 – 8.2 +13.2Operating profit (EBIT) 1 CHF m. 41.1 42.9 33.4 1 62.9 75.4Change vs. previous year Percent – 4.3 +28.7 – 47.0 – 16.5 +70.1Operating profit margin Percent 11.4 13.5 10.4 17.2 18.9EBITDA 1 CHF m. 78.9 79.0 66.6 1 94.3 101.9Change vs. previous year Percent – 0.1 +18.6 – 29.4 – 7.5 +26.9EBITDA margin Percent 21.9 24.8 20.7 25.7 25.5Net profit CHF m. 32.4 36.5 16.4 53.3 56.2Change vs. previous year Percent – 11.3 +122.9 – 69.3 – 5.1 + 81.1Cash flow from operating activities CHF m. 53.7 47.6 72.2 26.8 82.9Change vs. previous year Percent 12.8 – 34.1 +169.8 – 67.7 +38.5As % of net sales 14.9 15.0 22.5 7.3 20.8Total assets CHF m. 690.8 677.4 585.8 644.9 590.7Change vs. previous year Percent +2.0 +15.6 – 9.2 +9.2 +5.9Equity CHF m. 445.5 435.4 388.1 399.3 367.7Change vs. previous year Percent +2.3 +12.2 – 2.9 +8.6 +7.7Current assets CHF m. 250.5 227.8 201.3 240.3 221.3Change vs. previous year Percent +10.0 +13.2 – 16.1 +8.7 +3.6Non– current assets CHF m. 435.5 449.6 384.5 404.6 369.4Change vs. previous year Percent – 3.1 +16.9 – 5.0 +9.5 +7.3Current liabilities CHF m. 76.7 65.7 54.2 97.8 63.7Change vs. previous year Percent +16.7 +21.3 – 44.6 +53.4 +6.2Non– current liabilities CHF m. 168.7 176.4 143.6 147.3 159.2Change vs. previous year Percent – 4.4 +22.8 – 2.5 – 7.5 +1.8Capital expenditures CHF m. 35.8 29.6 26.3 68.8 77.0Change vs. previous year Percent +20.9 +12.5 – 61.7 – 10.7 – 13.0As % of net sales 9.9 9.3 8.2 18.8 19.3Depreciation charge /Impairment CHF m. 37.8 36.1 35.0 31.4 26.5Change vs. previous year Percent +4.7 +3.1 +11.5 +18.3 – 26.3As % of net sales 10.5 11.3 10.9 8.6 6.6Personnel expenses CHF m. 121.9 119 128.5 125.4 123.4Change vs. previous year Percent +2.4 – 7.4 +2.5 +1.6 +5.3As % of net sales 33.9 37.4 40.0 34.2 30.9Employees 2 Number 967 913 968 1 041 1 019Change vs. previous year Percent +5.9 – 5.7 – 7.0 +2.2 +0.9Sales per employee CHF 372 000 349 000 332 000 352 000 392 000Change vs. previous year Percent +6.6 +5.0 – 5.7 – 10.2 +12.312004 excluding CHF 10.2 million in restructuring costs, 2 Annual average86 Financial Statements <strong>Siegfried</strong> Group