
You also want an ePaper? Increase the reach of your titles
YUMPU automatically turns print PDFs into web optimized ePapers that Google loves.
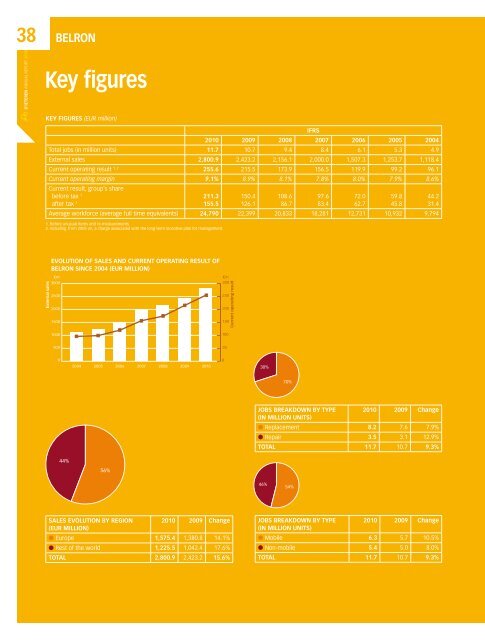
38<strong>BELRON</strong>D’IETEREN ANNUAL REPORT 2010Key figuresKEY FIGURES (EUR million)IFRS2010 2009 2008 2007 2006 2005 2004Total jobs (in million units) 11.7 10.7 9.4 8.4 6.1 5.3 4.9External sales 2,800.9 2,423.2 2,156.1 2,000.0 1,507.3 1,253.7 1,118.4Current operating result 1, 2 255.6 215.5 173.9 156.5 119.9 99.2 96.1Current operating margin 9.1% 8.9% 8.1% 7.8% 8.0% 7.9% 8.6%Current result, group’s sharebefore tax 1211.3after tax 1 155.5150.4126.1Average workforce (average full time equivalents) 24,790 22,399 20,833 18,281 12,731 10,932 9,7941. Before unusual items and re-measurements.2. Including, from 2005 on, a charge associated with the long-term incentive plan for management.108.686.797.683.472.062.759.845.844.231.4External salesEVOLUTION OF SALES AND CURRENT OPERATING RESULT OF<strong>BELRON</strong> SINCE 2004 (EUR MILLION)€m €m3000300250020001500250200150Current operating result10001005005002004 2005 2006 2007 2008 2009 2010030%70%JOBS BREAKDOWN BY TYPE(IN MILLION UNITS)2010 2009 Change● Replacement 8.2 7.6 7.9%● Repair 3.5 3.1 12.9%TOTAL 11.7 10.7 9.3%44%56%46%54%SALES EVOLUTION BY REGION(EUR MILLION)2010 2009 Change● Europe 1,575.4 1,380.8 14.1%● Rest of the world 1,225.5 1,042.4 17.6%TOTAL 2,800.9 2,423.2 15.6%JOBS BREAKDOWN BY TYPE(IN MILLION UNITS)2010 2009 Change● Mobile 6.3 5.7 10.5%● Non-mobile 5.4 5.0 8.0%TOTAL 11.7 10.7 9.3%