private and group tutoring in egypt: where is the gender inequality?
private and group tutoring in egypt: where is the gender inequality?
private and group tutoring in egypt: where is the gender inequality?

Create successful ePaper yourself
Turn your PDF publications into a flip-book with our unique Google optimized e-Paper software.
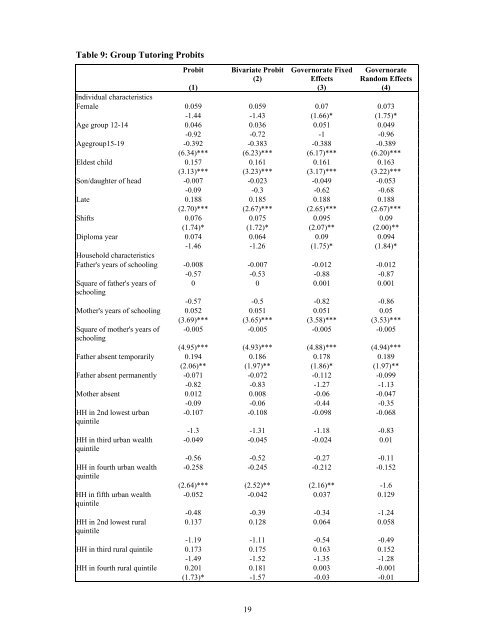
Table 9: Group Tutor<strong>in</strong>g ProbitsProbitBivariate Probit(2)Governorate FixedEffects(3)GovernorateR<strong>and</strong>om Effects(4)(1)Individual character<strong>is</strong>ticsFemale 0.059 0.059 0.07 0.073-1.44 -1.43 (1.66)* (1.75)*Age <strong>group</strong> 12-14 0.046 0.036 0.051 0.049-0.92 -0.72 -1 -0.96Age<strong>group</strong>15-19 -0.392 -0.383 -0.388 -0.389(6.34)*** (6.23)*** (6.17)*** (6.20)***Eldest child 0.157 0.161 0.161 0.163(3.13)*** (3.23)*** (3.17)*** (3.22)***Son/daughter of head -0.007 -0.023 -0.049 -0.053-0.09 -0.3 -0.62 -0.68Late 0.188 0.185 0.188 0.188(2.70)*** (2.67)*** (2.65)*** (2.67)***Shifts 0.076 0.075 0.095 0.09(1.74)* (1.72)* (2.07)** (2.00)**Diploma year 0.074 0.064 0.09 0.094-1.46 -1.26 (1.75)* (1.84)*Household character<strong>is</strong>ticsFa<strong>the</strong>r's years of school<strong>in</strong>g -0.008 -0.007 -0.012 -0.012-0.57 -0.53 -0.88 -0.87Square of fa<strong>the</strong>r's years ofschool<strong>in</strong>g0 0 0.001 0.001-0.57 -0.5 -0.82 -0.86Mo<strong>the</strong>r's years of school<strong>in</strong>g 0.052 0.051 0.051 0.05(3.69)*** (3.65)*** (3.58)*** (3.53)***Square of mo<strong>the</strong>r's years ofschool<strong>in</strong>g-0.005 -0.005 -0.005 -0.005(4.95)*** (4.93)*** (4.88)*** (4.94)***Fa<strong>the</strong>r absent temporarily 0.194 0.186 0.178 0.189(2.06)** (1.97)** (1.86)* (1.97)**Fa<strong>the</strong>r absent permanently -0.071 -0.072 -0.112 -0.099-0.82 -0.83 -1.27 -1.13Mo<strong>the</strong>r absent 0.012 0.008 -0.06 -0.047-0.09 -0.06 -0.44 -0.35HH <strong>in</strong> 2nd lowest urbanqu<strong>in</strong>tileHH <strong>in</strong> third urban wealthqu<strong>in</strong>tileHH <strong>in</strong> fourth urban wealthqu<strong>in</strong>tileHH <strong>in</strong> fifth urban wealthqu<strong>in</strong>tileHH <strong>in</strong> 2nd lowest ruralqu<strong>in</strong>tile-0.107 -0.108 -0.098 -0.068-1.3 -1.31 -1.18 -0.83-0.049 -0.045 -0.024 0.01-0.56 -0.52 -0.27 -0.11-0.258 -0.245 -0.212 -0.152(2.64)*** (2.52)** (2.16)** -1.6-0.052 -0.042 0.037 0.129-0.48 -0.39 -0.34 -1.240.137 0.128 0.064 0.058-1.19 -1.11 -0.54 -0.49HH <strong>in</strong> third rural qu<strong>in</strong>tile 0.173 0.175 0.163 0.152-1.49 -1.52 -1.35 -1.28HH <strong>in</strong> fourth rural qu<strong>in</strong>tile 0.201 0.181 0.003 -0.001(1.73)* -1.57 -0.03 -0.0119