private and group tutoring in egypt: where is the gender inequality?
private and group tutoring in egypt: where is the gender inequality?
private and group tutoring in egypt: where is the gender inequality?

You also want an ePaper? Increase the reach of your titles
YUMPU automatically turns print PDFs into web optimized ePapers that Google loves.
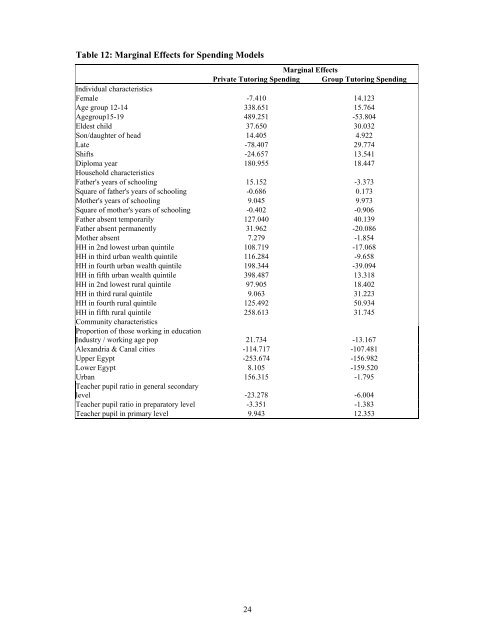
Table 12: Marg<strong>in</strong>al Effects for Spend<strong>in</strong>g ModelsMarg<strong>in</strong>al EffectsPrivate Tutor<strong>in</strong>g Spend<strong>in</strong>g Group Tutor<strong>in</strong>g Spend<strong>in</strong>gIndividual character<strong>is</strong>ticsFemale -7.410 14.123Age <strong>group</strong> 12-14 338.651 15.764Age<strong>group</strong>15-19 489.251 -53.804Eldest child 37.650 30.032Son/daughter of head 14.405 4.922Late -78.407 29.774Shifts -24.657 13.541Diploma year 180.955 18.447Household character<strong>is</strong>ticsFa<strong>the</strong>r's years of school<strong>in</strong>g 15.152 -3.373Square of fa<strong>the</strong>r's years of school<strong>in</strong>g -0.686 0.173Mo<strong>the</strong>r's years of school<strong>in</strong>g 9.045 9.973Square of mo<strong>the</strong>r's years of school<strong>in</strong>g -0.402 -0.906Fa<strong>the</strong>r absent temporarily 127.040 40.139Fa<strong>the</strong>r absent permanently 31.962 -20.086Mo<strong>the</strong>r absent 7.279 -1.854HH <strong>in</strong> 2nd lowest urban qu<strong>in</strong>tile 108.719 -17.068HH <strong>in</strong> third urban wealth qu<strong>in</strong>tile 116.284 -9.658HH <strong>in</strong> fourth urban wealth qu<strong>in</strong>tile 198.344 -39.094HH <strong>in</strong> fifth urban wealth qu<strong>in</strong>tile 398.487 13.318HH <strong>in</strong> 2nd lowest rural qu<strong>in</strong>tile 97.905 18.402HH <strong>in</strong> third rural qu<strong>in</strong>tile 9.063 31.223HH <strong>in</strong> fourth rural qu<strong>in</strong>tile 125.492 50.934HH <strong>in</strong> fifth rural qu<strong>in</strong>tile 258.613 31.745Community character<strong>is</strong>ticsProportion of those work<strong>in</strong>g <strong>in</strong> educationIndustry / work<strong>in</strong>g age pop 21.734 -13.167Alex<strong>and</strong>ria & Canal cities -114.717 -107.481Upper Egypt -253.674 -156.982Lower Egypt 8.105 -159.520Urban 156.315 -1.795Teacher pupil ratio <strong>in</strong> general secondarylevel -23.278 -6.004Teacher pupil ratio <strong>in</strong> preparatory level -3.351 -1.383Teacher pupil <strong>in</strong> primary level 9.943 12.35324