Wind Energy Feasibility Study - Town Of Orleans
Wind Energy Feasibility Study - Town Of Orleans
Wind Energy Feasibility Study - Town Of Orleans

You also want an ePaper? Increase the reach of your titles
YUMPU automatically turns print PDFs into web optimized ePapers that Google loves.
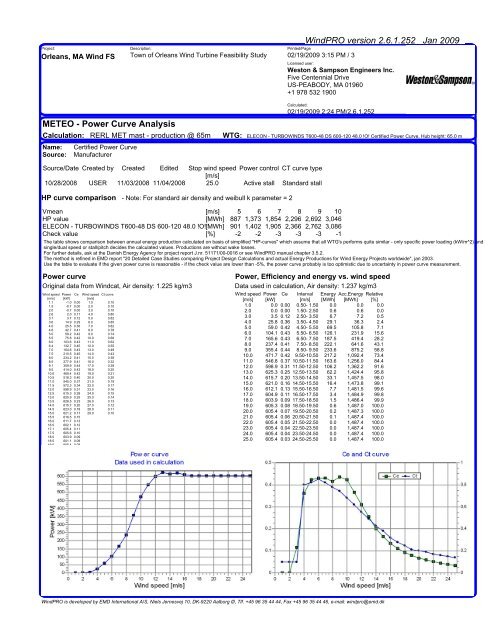
Project:<strong>Orleans</strong>, MA <strong>Wind</strong> FSDescription:<strong>Town</strong> of <strong>Orleans</strong> <strong>Wind</strong> Turbine <strong>Feasibility</strong> <strong>Study</strong><strong>Wind</strong>PRO version 2.6.1.252 Jan 2009Printed/Page02/19/2009 3:15 PM / 3Licensed user:Weston & Sampson Engineers Inc.Five Centennial DriveUS-PEABODY, MA 01960+1 978 532 1900METEO - Power Curve AnalysisCalculation: RERL MET mast - production @ 65mName: Certified Power CurveSource: ManufacturerCalculated:02/19/2009 2:24 PM/2.6.1.252WTG: ELECON - TURBOWINDS T600-48 DS 600-120 48.0 !O! Certified Power Curve, Hub height: 65.0 mSource/Date Created by Created Edited Stop wind speed Power control CT curve type[m/s]10/28/2008 USER 11/03/2008 11/04/2008 25.0 Active stall Standard stallHP curve comparison - Note: For standard air density and weibull k parameter = 2Vmean [m/s] 5 6 7 8 9 10HP value [MWh] 887 1,373 1,854 2,296 2,692 3,046ELECON - TURBOWINDS T600-48 DS 600-120 48.0 !O![MWh] 901 1,402 1,905 2,366 2,762 3,086Check value [%] -2 -2 -3 -3 -3 -1The table shows comparison between annual energy production calculated on basis of simplified "HP-curves" which assume that all WTG's performs quite similar - only specific power loading (kW/m^2) andsingle/dual speed or stall/pitch decides the calculated values. Productions are without wake losses.For further details, ask at the Danish <strong>Energy</strong> Agency for project report J.nr. 51171/00-0016 or see <strong>Wind</strong>PRO manual chapter 3.5.2.The method is refined in EMD report "20 Detailed Case Studies comparing Project Design Calculations and actual <strong>Energy</strong> Productions for <strong>Wind</strong> <strong>Energy</strong> Projects worldwide", jan 2003.Use the table to evaluate if the given power curve is reasonable - if the check value are lower than -5%, the power curve probably is too optimistic due to uncertainty in power curve measurement.Power curveOriginal data from <strong>Wind</strong>cat, Air density: 1.225 kg/m3<strong>Wind</strong> speed Power Ce <strong>Wind</strong> speed Ct curve[m/s] [kW] [m/s]1.1 -1.0 0.00 1.0 0.101.5 -0.7 0.00 2.0 0.102.0 -0.7 0.00 3.0 0.102.6 2.0 0.11 4.0 0.803.1 3.7 0.12 5.0 0.823.6 14.9 0.29 6.0 0.854.0 25.5 0.36 7.0 0.824.6 42.7 0.41 8.0 0.785.0 59.2 0.42 9.0 0.745.5 75.8 0.42 10.0 0.686.0 103.6 0.43 11.0 0.626.4 132.7 0.45 12.0 0.557.0 164.6 0.43 13.0 0.497.5 210.5 0.45 14.0 0.438.0 234.2 0.41 15.0 0.388.5 277.9 0.41 16.0 0.329.1 359.9 0.44 17.0 0.289.5 414.0 0.43 18.0 0.2510.0 469.4 0.42 19.0 0.2110.5 518.3 0.40 20.0 0.2011.0 545.0 0.37 21.0 0.1911.5 572.3 0.34 22.0 0.1712.0 598.9 0.31 23.0 0.1612.5 615.3 0.28 24.0 0.1513.0 625.9 0.25 25.0 0.1413.5 628.5 0.23 26.0 0.1314.0 615.7 0.20 27.0 0.1214.5 623.0 0.18 28.0 0.1115.0 621.2 0.17 29.0 0.1015.5 616.5 0.1516.0 611.7 0.1316.5 602.1 0.1217.1 605.4 0.1117.5 605.6 0.1018.0 603.9 0.0918.5 601.1 0.0819.0 605.4 0.08Power, Efficiency and energy vs. wind speedData used in calculation, Air density: 1.237 kg/m3<strong>Wind</strong> speed Power Ce Interval <strong>Energy</strong> Acc.<strong>Energy</strong> Relative[m/s] [kW] [m/s] [MWh] [MWh] [%]1.0 0.0 0.00 0.50- 1.50 0.0 0.0 0.02.0 0.0 0.00 1.50- 2.50 0.6 0.6 0.03.0 3.5 0.12 2.50- 3.50 6.7 7.2 0.54.0 25.8 0.36 3.50- 4.50 29.1 36.3 2.45.0 59.0 0.42 4.50- 5.50 69.5 105.8 7.16.0 104.1 0.43 5.50- 6.50 126.1 231.9 15.67.0 165.6 0.43 6.50- 7.50 187.5 419.4 28.28.0 237.4 0.41 7.50- 8.50 222.1 641.6 43.19.0 355.4 0.44 8.50- 9.50 233.6 875.2 58.810.0 471.7 0.42 9.50-10.50 217.2 1,092.4 73.411.0 546.8 0.37 10.50-11.50 163.6 1,256.0 84.412.0 598.9 0.31 11.50-12.50 106.2 1,362.2 91.613.0 625.3 0.25 12.50-13.50 62.2 1,424.4 95.814.0 615.7 0.20 13.50-14.50 33.1 1,457.5 98.015.0 621.0 0.16 14.50-15.50 16.4 1,473.8 99.116.0 612.1 0.13 15.50-16.50 7.7 1,481.5 99.617.0 604.9 0.11 16.50-17.50 3.4 1,484.9 99.818.0 603.9 0.09 17.50-18.50 1.5 1,486.4 99.919.0 605.3 0.08 18.50-19.50 0.6 1,487.0 100.020.0 605.4 0.07 19.50-20.50 0.2 1,487.3 100.021.0 605.4 0.06 20.50-21.50 0.1 1,487.4 100.022.0 605.4 0.05 21.50-22.50 0.0 1,487.4 100.023.0 605.4 0.04 22.50-23.50 0.0 1,487.4 100.024.0 605.4 0.04 23.50-24.50 0.0 1,487.4 100.025.0 605.4 0.03 24.50-25.50 0.0 1,487.4 100.0<strong>Wind</strong>PRO is developed by EMD International A/S, Niels Jernesvej 10, DK-9220 Aalborg Ø, Tlf. +45 96 35 44 44, Fax +45 96 35 44 46, e-mail: windpro@emd.dk