Controlling for Heterogeneity in Gravity Models of Trade
Controlling for Heterogeneity in Gravity Models of Trade
Controlling for Heterogeneity in Gravity Models of Trade

Create successful ePaper yourself
Turn your PDF publications into a flip-book with our unique Google optimized e-Paper software.
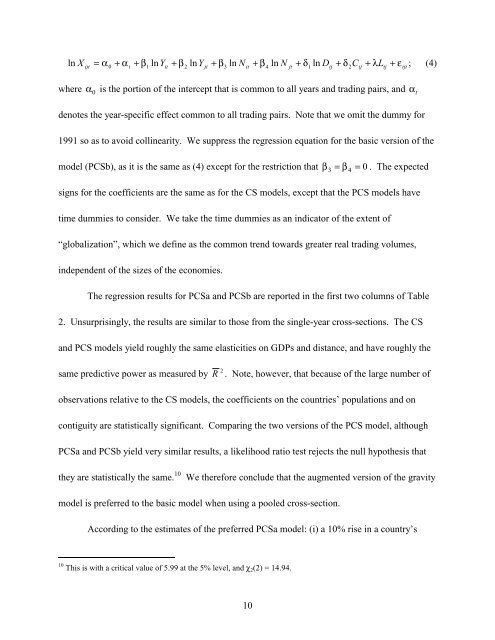
ln Xijt= α0+ αt+ β1lnYit+ β2lnYjt+ β3ln Nit+ β4ln Njt+ δ1ln Dij+ δ2Cij+ λLij+ εijt; (4)where α 0 is the portion <strong>of</strong> the <strong>in</strong>tercept that is common to all years and trad<strong>in</strong>g pairs, anddenotes the year-specific effect common to all trad<strong>in</strong>g pairs. Note that we omit the dummy <strong>for</strong>1991 so as to avoid coll<strong>in</strong>earity. We suppress the regression equation <strong>for</strong> the basic version <strong>of</strong> themodel (PCSb), as it is the same as (4) except <strong>for</strong> the restriction that β = β 0 . The expected3 4 =signs <strong>for</strong> the coefficients are the same as <strong>for</strong> the CS models, except that the PCS models havetime dummies to consider. We take the time dummies as an <strong>in</strong>dicator <strong>of</strong> the extent <strong>of</strong>“globalization”, which we def<strong>in</strong>e as the common trend towards greater real trad<strong>in</strong>g volumes,<strong>in</strong>dependent <strong>of</strong> the sizes <strong>of</strong> the economies.The regression results <strong>for</strong> PCSa and PCSb are reported <strong>in</strong> the first two columns <strong>of</strong> Table2. Unsurpris<strong>in</strong>gly, the results are similar to those from the s<strong>in</strong>gle-year cross-sections. The CSand PCS models yield roughly the same elasticities on GDPs and distance, and have roughly thesame predictive power as measured by2R . Note, however, that because <strong>of</strong> the large number <strong>of</strong>observations relative to the CS models, the coefficients on the countries’ populations and oncontiguity are statistically significant. Compar<strong>in</strong>g the two versions <strong>of</strong> the PCS model, althoughPCSa and PCSb yield very similar results, a likelihood ratio test rejects the null hypothesis thatαtthey are statistically the same. 10We there<strong>for</strong>e conclude that the augmented version <strong>of</strong> the gravitymodel is preferred to the basic model when us<strong>in</strong>g a pooled cross-section.Accord<strong>in</strong>g to the estimates <strong>of</strong> the preferred PCSa model: (i) a 10% rise <strong>in</strong> a country’s10 This is with a critical value <strong>of</strong> 5.99 at the 5% level, and χ 2 (2) = 14.94.10