Feenstra. R. C., J.A. Markusen, and A.K. Rose, 1998, “Understand<strong>in</strong>g the Home Market Effectand the <strong>Gravity</strong> Equation: The Role <strong>of</strong> Differentiat<strong>in</strong>g Goods,” NBER Work<strong>in</strong>g Paper 6804.Frankel, F., Ste<strong>in</strong>, E. and S. Wei, 1995, “Trad<strong>in</strong>g Blocs and Americas: the Natural, the Unnatural,and the Super-natural,” Journal <strong>of</strong> Development Economics, 47, 61-95.Frankel, F., Ste<strong>in</strong>, E. and S. Wei, 1998, “Cont<strong>in</strong>ental Trad<strong>in</strong>g Blocs: Are they Natural orSupernatural?,” <strong>in</strong> J.A. Frankel, Ed., The Regionalization <strong>of</strong> the World Economy, University<strong>of</strong> Chicago Press.Frankel, F. and S. Wei, 1998, “Regionalization <strong>of</strong> World <strong>Trade</strong> and Currencies,” <strong>in</strong> J. A. Frankel,Ed., The Regionalization <strong>of</strong> the World Economy, University <strong>of</strong> Chicago Press.Helliwell, J., 1996, “Do National Borders Matter <strong>for</strong> Quebec’s <strong>Trade</strong>?” Canadian Journal <strong>of</strong>Economics, 29, 507-522.Hummels, D. and J. Lev<strong>in</strong>sohn, 1995, “Monopolistic Competition and International <strong>Trade</strong>:Reconsider<strong>in</strong>g the Evidence,” Quarterly Journal <strong>of</strong> Economics, 110, 799-836.L<strong>in</strong>nemann, H., 1966, An Econometric Study <strong>of</strong> International <strong>Trade</strong> Flows, North-Holland.McCallum, J., “National Borders Matter: Canada-U.S. Regional <strong>Trade</strong> Patterns,” AmericanEconomic Review, 85, 615-623.Mátyás, L., 1997, “Proper Econometric Specification <strong>of</strong> the <strong>Gravity</strong> Model,” The WorldEconomy, 20, 363-368.Oguledo, V. I. and C. R. MacPhee, 1994, “<strong>Gravity</strong> Model: A Re<strong>for</strong>mulation and an Applicationto Discrim<strong>in</strong>atory <strong>Trade</strong> Arrangements,” Applied Economics, 40, 315-337.Pöyhönen, P., 1963, “A Tentative Model <strong>for</strong> the Volume <strong>of</strong> <strong>Trade</strong> Between Countries,”Weltwirtschaftliches Archive, 90, 93-100.Sanso, M., R. Cuairan, and F. Sanz, 1993, “Bilateral <strong>Trade</strong> Flows, the <strong>Gravity</strong> Equation, andFunctional Form,” Review <strong>of</strong> Economics and Statistics, 75, 266-275.Sen, A. and T. E. Smith, 1995, <strong>Gravity</strong> <strong>Models</strong> <strong>of</strong> Spatial Interaction Behavior, Spr<strong>in</strong>ger-Verlag.Smith. P.J., 1999, “Are Weak Patent Rights a Barrier to US Exports?” Journal <strong>of</strong> InternationalEconomics, <strong>for</strong>thcom<strong>in</strong>g.T<strong>in</strong>bergen, J., 1962, Shap<strong>in</strong>g the World Economy - Suggestions <strong>for</strong> an International EconomicPolicy, The Twentieth Century Fund.Wei, S.J. and J.A. Frankel, 1997, “Open versus Closed Trad<strong>in</strong>g Blocs,” <strong>in</strong> T. Ito and A. Krueger,Eds., Regionalism versus Multilateral <strong>Trade</strong> Arrangements, University <strong>of</strong> Chicago Press.26
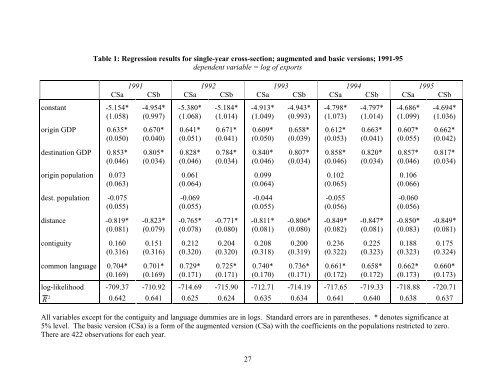
Table 1: Regression results <strong>for</strong> s<strong>in</strong>gle-year cross-section; augmented and basic versions; 1991-95dependent variable = log <strong>of</strong> exports1991 1992 1993 1994 1995CSa CSb CSa CSb CSa CSb CSa CSb CSa CSbconstant -5.154*(1.058)-4.954*(0.997)-5.380*(1.068)-5.184*(1.014)-4.913*(1.049)-4.943*(0.993)-4.798*(1.073)-4.797*(1.014)-4.686*(1.099)-4.694*(1.036)orig<strong>in</strong> GDP 0.635*(0.050)0.670*(0.040)0.641*(0.051)0.671*(0.041)0.609*(0.050)0.658*(0.039)0.612*(0.053)0.663*(0.041)0.607*(0.055)0.662*(0.042)dest<strong>in</strong>ation GDP 0.853*(0.046)0.805*(0.034)0.828*(0.046)0.784*(0.034)0.840*(0.046)0.807*(0.034)0.858*(0.046)0.820*(0.034)0.857*(0.046)0.817*(0.034)orig<strong>in</strong> population 0.073(0.063)0.061(0.064)0.099(0.064)0.102(0.065)0.106(0.066)dest. population -0.075(0.055)-0.069(0.055)-0.044(0.055)-0.055(0.056)-0.060(0.056)distance -0.819*(0.081)-0.823*(0.079)-0.765*(0.078)-0.771*(0.080)-0.811*(0.081)-0.806*(0.080)-0.849*(0.082)-0.847*(0.081)-0.850*(0.083)-0.849*(0.081)contiguity 0.160(0.316)0.151(0.316)0.212(0.320)0.204(0.320)0.208(0.318)0.200(0.319)0.236(0.322)0.225(0.323)0.188(0.323)0.175(0.324)common language 0.704*(0.169)0.701*(0.169)0.729*(0.171)0.725*(0.171)0.740*(0.170)0.736*(0.171)0.661*(0.172)0.658*(0.172)0.662*(0.173)0.660*(0.173)log-likelihood -709.37 -710.92 -714.69 -715.90 -712.71 -714.19 -717.65 -719.33 -718.88 -720.712R 0.642 0.641 0.625 0.624 0.635 0.634 0.641 0.640 0.638 0.637All variables except <strong>for</strong> the contiguity and language dummies are <strong>in</strong> logs. Standard errors are <strong>in</strong> parentheses. * denotes significance at5% level. The basic version (CSa) is a <strong>for</strong>m <strong>of</strong> the augmented version (CSa) with the coefficients on the populations restricted to zero.There are 422 observations <strong>for</strong> each year.27