

Download "Predicting E. coli inactivation in uncooked comminuted ...
Download "Predicting E. coli inactivation in uncooked comminuted ...
Download "Predicting E. coli inactivation in uncooked comminuted ...

You also want an ePaper? Increase the reach of your titles
YUMPU automatically turns print PDFs into web optimized ePapers that Google loves.
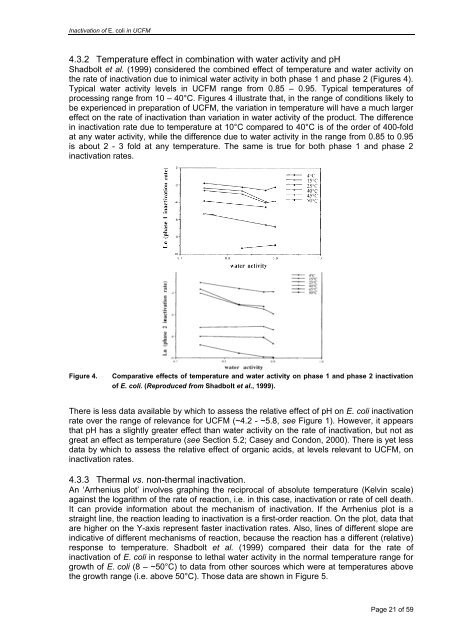
Inactivation of E. <strong>coli</strong> <strong>in</strong> UCFM4.3.2 Temperature effect <strong>in</strong> comb<strong>in</strong>ation with water activity and pHShadbolt et al. (1999) considered the comb<strong>in</strong>ed effect of temperature and water activity onthe rate of <strong><strong>in</strong>activation</strong> due to <strong>in</strong>imical water activity <strong>in</strong> both phase 1 and phase 2 (Figures 4).Typical water activity levels <strong>in</strong> UCFM range from 0.85 – 0.95. Typical temperatures ofprocess<strong>in</strong>g range from 10 – 40°C. Figures 4 illustrate that, <strong>in</strong> the range of conditions likely tobe experienced <strong>in</strong> preparation of UCFM, the variation <strong>in</strong> temperature will have a much largereffect on the rate of <strong><strong>in</strong>activation</strong> than variation <strong>in</strong> water activity of the product. The difference<strong>in</strong> <strong><strong>in</strong>activation</strong> rate due to temperature at 10°C compared to 40°C is of the order of 400-foldat any water activity, while the difference due to water activity <strong>in</strong> the range from 0.85 to 0.95is about 2 - 3 fold at any temperature. The same is true for both phase 1 and phase 2<strong><strong>in</strong>activation</strong> rates.Figure 4.Comparative effects of temperature and water activity on phase 1 and phase 2 <strong><strong>in</strong>activation</strong>of E. <strong>coli</strong>. (Reproduced from Shadbolt et al., 1999).There is less data available by which to assess the relative effect of pH on E. <strong>coli</strong> <strong><strong>in</strong>activation</strong>rate over the range of relevance for UCFM (~4.2 - ~5.8, see Figure 1). However, it appearsthat pH has a slightly greater effect than water activity on the rate of <strong><strong>in</strong>activation</strong>, but not asgreat an effect as temperature (see Section 5.2; Casey and Condon, 2000). There is yet lessdata by which to assess the relative effect of organic acids, at levels relevant to UCFM, on<strong><strong>in</strong>activation</strong> rates.4.3.3 Thermal vs. non-thermal <strong><strong>in</strong>activation</strong>.An ‘Arrhenius plot’ <strong>in</strong>volves graph<strong>in</strong>g the reciprocal of absolute temperature (Kelv<strong>in</strong> scale)aga<strong>in</strong>st the logarithm of the rate of reaction, i.e. <strong>in</strong> this case, <strong><strong>in</strong>activation</strong> or rate of cell death.It can provide <strong>in</strong>formation about the mechanism of <strong><strong>in</strong>activation</strong>. If the Arrhenius plot is astraight l<strong>in</strong>e, the reaction lead<strong>in</strong>g to <strong><strong>in</strong>activation</strong> is a first-order reaction. On the plot, data thatare higher on the Y-axis represent faster <strong><strong>in</strong>activation</strong> rates. Also, l<strong>in</strong>es of different slope are<strong>in</strong>dicative of different mechanisms of reaction, because the reaction has a different (relative)response to temperature. Shadbolt et al. (1999) compared their data for the rate of<strong><strong>in</strong>activation</strong> of E. <strong>coli</strong> <strong>in</strong> response to lethal water activity <strong>in</strong> the normal temperature range forgrowth of E. <strong>coli</strong> (8 – ~50°C) to data from other sources which were at temperatures abovethe growth range (i.e. above 50°C). Those data are shown <strong>in</strong> Figure 5.Page 21 of 59