

Download "Predicting E. coli inactivation in uncooked comminuted ...
Download "Predicting E. coli inactivation in uncooked comminuted ...
Download "Predicting E. coli inactivation in uncooked comminuted ...

You also want an ePaper? Increase the reach of your titles
YUMPU automatically turns print PDFs into web optimized ePapers that Google loves.
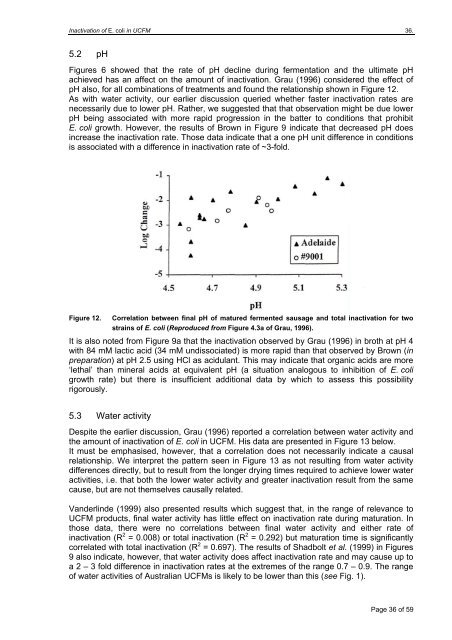
Inactivation of E. <strong>coli</strong> <strong>in</strong> UCFM 36.5.2 pHFigures 6 showed that the rate of pH decl<strong>in</strong>e dur<strong>in</strong>g fermentation and the ultimate pHachieved has an affect on the amount of <strong><strong>in</strong>activation</strong>. Grau (1996) considered the effect ofpH also, for all comb<strong>in</strong>ations of treatments and found the relationship shown <strong>in</strong> Figure 12.As with water activity, our earlier discussion queried whether faster <strong><strong>in</strong>activation</strong> rates arenecessarily due to lower pH. Rather, we suggested that that observation might be due lowerpH be<strong>in</strong>g associated with more rapid progression <strong>in</strong> the batter to conditions that prohibitE. <strong>coli</strong> growth. However, the results of Brown <strong>in</strong> Figure 9 <strong>in</strong>dicate that decreased pH does<strong>in</strong>crease the <strong><strong>in</strong>activation</strong> rate. Those data <strong>in</strong>dicate that a one pH unit difference <strong>in</strong> conditionsis associated with a difference <strong>in</strong> <strong><strong>in</strong>activation</strong> rate of ~3-fold.Figure 12.Correlation between f<strong>in</strong>al pH of matured fermented sausage and total <strong><strong>in</strong>activation</strong> for twostra<strong>in</strong>s of E. <strong>coli</strong> (Reproduced from Figure 4.3a of Grau, 1996).It is also noted from Figure 9a that the <strong><strong>in</strong>activation</strong> observed by Grau (1996) <strong>in</strong> broth at pH 4with 84 mM lactic acid (34 mM undissociated) is more rapid than that observed by Brown (<strong>in</strong>preparation) at pH 2.5 us<strong>in</strong>g HCl as acidulant. This may <strong>in</strong>dicate that organic acids are more‘lethal’ than m<strong>in</strong>eral acids at equivalent pH (a situation analogous to <strong>in</strong>hibition of E. <strong>coli</strong>growth rate) but there is <strong>in</strong>sufficient additional data by which to assess this possibilityrigorously.5.3 Water activityDespite the earlier discussion, Grau (1996) reported a correlation between water activity andthe amount of <strong><strong>in</strong>activation</strong> of E. <strong>coli</strong> <strong>in</strong> UCFM. His data are presented <strong>in</strong> Figure 13 below.It must be emphasised, however, that a correlation does not necessarily <strong>in</strong>dicate a causalrelationship. We <strong>in</strong>terpret the pattern seen <strong>in</strong> Figure 13 as not result<strong>in</strong>g from water activitydifferences directly, but to result from the longer dry<strong>in</strong>g times required to achieve lower wateractivities, i.e. that both the lower water activity and greater <strong><strong>in</strong>activation</strong> result from the samecause, but are not themselves causally related.Vanderl<strong>in</strong>de (1999) also presented results which suggest that, <strong>in</strong> the range of relevance toUCFM products, f<strong>in</strong>al water activity has little effect on <strong><strong>in</strong>activation</strong> rate dur<strong>in</strong>g maturation. Inthose data, there were no correlations between f<strong>in</strong>al water activity and either rate of<strong><strong>in</strong>activation</strong> (R 2 = 0.008) or total <strong><strong>in</strong>activation</strong> (R 2 = 0.292) but maturation time is significantlycorrelated with total <strong><strong>in</strong>activation</strong> (R 2 = 0.697). The results of Shadbolt et al. (1999) <strong>in</strong> Figures9 also <strong>in</strong>dicate, however, that water activity does affect <strong><strong>in</strong>activation</strong> rate and may cause up toa 2 – 3 fold difference <strong>in</strong> <strong><strong>in</strong>activation</strong> rates at the extremes of the range 0.7 – 0.9. The rangeof water activities of Australian UCFMs is likely to be lower than this (see Fig. 1).Page 36 of 59