BERND PAPE Asset Allocation, Multivariate Position Based Trading ...
BERND PAPE Asset Allocation, Multivariate Position Based Trading ...
BERND PAPE Asset Allocation, Multivariate Position Based Trading ...

You also want an ePaper? Increase the reach of your titles
YUMPU automatically turns print PDFs into web optimized ePapers that Google loves.
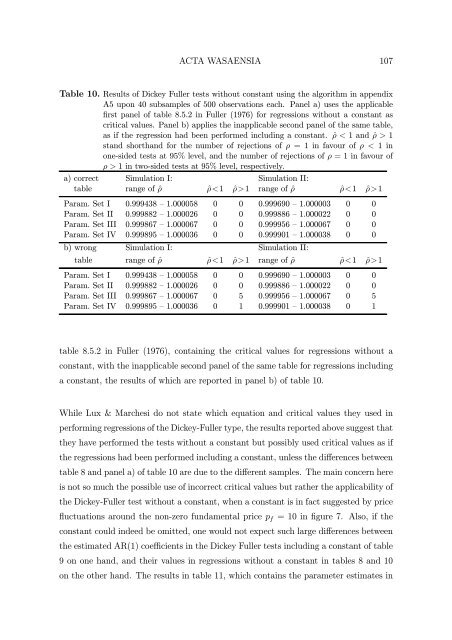
ACTA WASAENSIA 107Table 10. Results of Dickey Fuller tests without constant using the algorithm in appendixA5 upon 40 subsamples of 500 observations each. Panel a) uses the applicablefirst panel of table 8.5.2 in Fuller (1976) for regressions without a constant ascritical values. Panel b) applies the inapplicable second panel of the same table,as if the regression had been performed including a constant. ˆρ < 1andˆρ > 1stand shorthand for the number of rejections of ρ =1infavourofρ < 1inone-sided tests at 95% level, and the number of rejections of ρ =1infavourofρ > 1 in two-sided tests at 95% level, respectively.a) correct Simulation I: Simulation II:table range of ˆρ ˆρ1 range of ˆρ ˆρ1Param. Set I 0.999438 — 1.000058 0 0 0.999690 — 1.000003 0 0Param. Set II 0.999882 — 1.000026 0 0 0.999886 — 1.000022 0 0Param. Set III 0.999867 — 1.000067 0 0 0.999956 — 1.000067 0 0Param. Set IV 0.999895 — 1.000036 0 0 0.999901 — 1.000038 0 0b) wrong Simulation I: Simulation II:table range of ˆρ ˆρ1 range of ˆρ ˆρ1Param. Set I 0.999438 — 1.000058 0 0 0.999690 — 1.000003 0 0Param. Set II 0.999882 — 1.000026 0 0 0.999886 — 1.000022 0 0Param. Set III 0.999867 — 1.000067 0 5 0.999956 — 1.000067 0 5Param. Set IV 0.999895 — 1.000036 0 1 0.999901 — 1.000038 0 1table 8.5.2 in Fuller (1976), containing the critical values for regressions without aconstant, with the inapplicable second panel of the same table for regressions includinga constant, the results of which are reported in panel b) of table 10.While Lux & Marchesi do not state which equation and critical values they used inperforming regressions of the Dickey-Fuller type, the results reported above suggest thatthey have performed the tests without a constant but possibly used critical values as ifthe regressions had been performed including a constant, unless the differences betweentable 8 and panel a) of table 10 are due to the different samples. The main concern hereis not so much the possible use of incorrect critical values but rather the applicability ofthe Dickey-Fuller test without a constant, when a constant is in fact suggested by pricefluctuations around the non-zero fundamental price p f =10infigure 7. Also, if theconstant could indeed be omitted, one would not expect such large differences betweenthe estimated AR(1) coefficients in the Dickey Fuller tests including a constant of table9 on one hand, and their values in regressions without a constant in tables 8 and 10on the other hand. The results in table 11, which contains the parameter estimates in