BERND PAPE Asset Allocation, Multivariate Position Based Trading ...
BERND PAPE Asset Allocation, Multivariate Position Based Trading ...
BERND PAPE Asset Allocation, Multivariate Position Based Trading ...

Create successful ePaper yourself
Turn your PDF publications into a flip-book with our unique Google optimized e-Paper software.
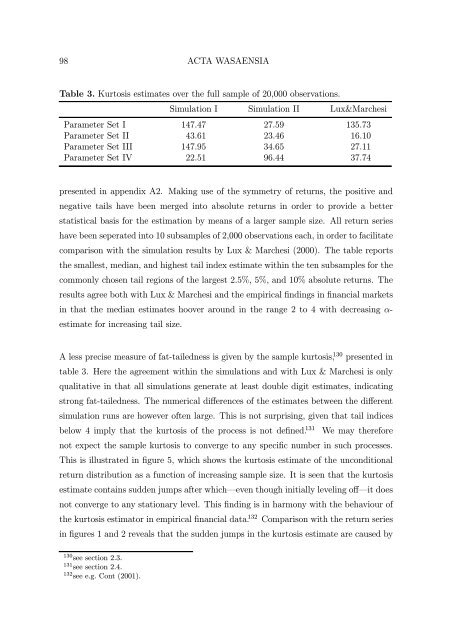
98 ACTA WASAENSIATable 3. Kurtosis estimates over the full sample of 20,000 observations.Simulation I Simulation II Lux&MarchesiParameter Set I 147.47 27.59 135.73Parameter Set II 43.61 23.46 16.10Parameter Set III 147.95 34.65 27.11Parameter Set IV 22.51 96.44 37.74presented in appendix A2. Making use of the symmetry of returns, the positive andnegative tails have been merged into absolute returns in order to provide a betterstatistical basis for the estimation by means of a larger sample size. All return serieshave been seperated into 10 subsamples of 2,000 observations each, in order to facilitatecomparison with the simulation results by Lux & Marchesi (2000). The table reportsthe smallest, median, and highest tail index estimate within the ten subsamples for thecommonly chosen tail regions of the largest 2.5%, 5%, and 10% absolute returns. Theresults agree both with Lux & Marchesi and the empirical findings in financial marketsin that the median estimates hoover around in the range 2 to 4 with decreasing α-estimate for increasing tail size.A less precise measure of fat-tailedness is given by the sample kurtosis, 130 presented intable 3. Here the agreement within the simulations and with Lux & Marchesi is onlyqualitative in that all simulations generate at least double digit estimates, indicatingstrong fat-tailedness. The numerical differences of the estimates between the differentsimulation runs are however often large. This is not surprising, given that tail indicesbelow 4 imply that the kurtosis of the process is not defined. 131 We may thereforenotexpectthesamplekurtosistoconvergetoanyspecific number in such processes.This is illustrated in figure 5, which shows the kurtosis estimate of the unconditionalreturn distribution as a function of increasing sample size. It is seen that the kurtosisestimate contains sudden jumps after which–even though initially leveling off–it doesnot converge to any stationary level. This finding is in harmony with the behaviour ofthe kurtosis estimator in empirical financial data. 132 Comparison with the return seriesin figures 1 and 2 reveals that the sudden jumps in the kurtosis estimate are caused by130 see section 2.3.131 see section 2.4.132 see e.g. Cont (2001).