BERND PAPE Asset Allocation, Multivariate Position Based Trading ...
BERND PAPE Asset Allocation, Multivariate Position Based Trading ...
BERND PAPE Asset Allocation, Multivariate Position Based Trading ...

Create successful ePaper yourself
Turn your PDF publications into a flip-book with our unique Google optimized e-Paper software.
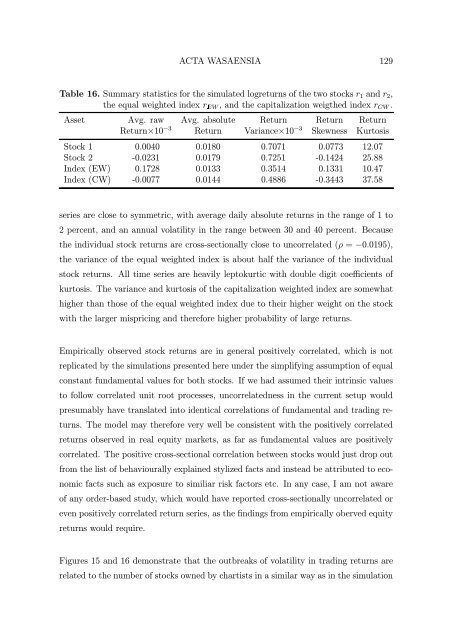
ACTA WASAENSIA 129Table 16. Summary statistics for the simulated logreturns of the two stocks r 1 and r 2 ,the equal weighted index r EW , and the capitalization weigthed index r CW .<strong>Asset</strong> Avg. raw Avg. absolute Return Return ReturnReturn×10 −3 Return Variance×10 −3 Skewness KurtosisStock 1 0.0040 0.0180 0.7071 0.0773 12.07Stock 2 -0.0231 0.0179 0.7251 -0.1424 25.88Index (EW) 0.1728 0.0133 0.3514 0.1331 10.47Index (CW) -0.0077 0.0144 0.4886 -0.3443 37.58series are close to symmetric, with average daily absolute returns in the range of 1 to2percent,andanannualvolatilityintherange between 30 and 40 percent. Becausethe individual stock returns are cross-sectionally close to uncorrelated (ρ = −0.0195),the variance of the equal weighted index is about half the variance of the individualstock returns. All time series are heavily leptokurtic with double digit coefficients ofkurtosis. The variance and kurtosis of the capitalization weighted index are somewhathigher than those of the equal weighted index due to their higher weight on the stockwith the larger mispricing and therefore higher probability of large returns.Empirically observed stock returns are in general positively correlated, which is notreplicated by the simulations presented here under the simplifying assumption of equalconstant fundamental values for both stocks. If we had assumed their intrinsic valuesto follow correlated unit root processes, uncorrelatedness in the current setup wouldpresumably have translated into identical correlations of fundamental and trading returns.The model may therefore very well be consistent with the positively correlatedreturns observed in real equity markets, as far as fundamental values are positivelycorrelated. The positive cross-sectional correlation between stocks would just drop outfrom the list of behaviourally explained stylized facts and instead be attributed to economicfacts such as exposure to similiar risk factors etc. In any case, I am not awareof any order-based study, which would have reported cross-sectionally uncorrelated oreven positively correlated return series, as the findings from empirically oberved equityreturns would require.Figures 15 and 16 demonstrate that the outbreaks of volatility in trading returns arerelated to the number of stocks owned by chartists in a similar way as in the simulation