- Page 5 and 6:
ACTA WASAENSIA 52.10.1 Cross-Sectio
- Page 7 and 8:
ACTA WASAENSIA 7A5 Matlabcodeforerr
- Page 10 and 11:
10 ACTA WASAENSIAIn chapter 5 I sha
- Page 12 and 13:
12 ACTA WASAENSIA2 Statistical Prop
- Page 14:
14 ACTA WASAENSIA2.2 Absence of Ser
- Page 17 and 18:
ACTA WASAENSIA 17The survival or ta
- Page 19 and 20:
ACTA WASAENSIA 19& Scheinkman (1987
- Page 21 and 22:
ACTA WASAENSIA 212.6 Long Range Dep
- Page 23 and 24:
ACTA WASAENSIA 23A particular class
- Page 26 and 27:
26 ACTA WASAENSIAMultiscaling may t
- Page 28 and 29:
28 ACTA WASAENSIAHansen (1982) to c
- Page 30 and 31:
30 ACTA WASAENSIAThe leverage hypot
- Page 32 and 33:
32 ACTA WASAENSIAIn order to aviod
- Page 34 and 35:
34 ACTA WASAENSIAon a risk-adjusted
- Page 36 and 37:
36 ACTA WASAENSIAplanations for the
- Page 38 and 39:
38 ACTA WASAENSIAspeculative prices
- Page 40 and 41:
40 ACTA WASAENSIAindex α is howeve
- Page 42 and 43:
42 ACTA WASAENSIAThis approach has
- Page 44 and 45:
44 ACTA WASAENSIAimplying exponenti
- Page 46 and 47:
46 ACTA WASAENSIA3.2.4 Descriptive
- Page 48 and 49:
48 ACTA WASAENSIAdivisible version
- Page 50 and 51:
50 ACTA WASAENSIAto check their ade
- Page 52 and 53:
52 ACTA WASAENSIAvolatility into th
- Page 54 and 55:
54 ACTA WASAENSIAfeedback of the co
- Page 56 and 57:
56 ACTA WASAENSIAarriving at the fo
- Page 58 and 59:
58 ACTA WASAENSIAat iteration k com
- Page 60 and 61:
60 ACTA WASAENSIAmultipliers in the
- Page 62 and 63:
62 ACTA WASAENSIALux & Ausloos (200
- Page 64 and 65:
64 ACTA WASAENSIAmarkets dominated
- Page 66 and 67:
66 ACTA WASAENSIAThe “representat
- Page 68 and 69:
68 ACTA WASAENSIA(1983) 114 motivat
- Page 70 and 71:
70 ACTA WASAENSIAIn the following w
- Page 72 and 73:
72 ACTA WASAENSIASethi (1996) exten
- Page 74 and 75:
74 ACTA WASAENSIASummation over all
- Page 76 and 77: 76 ACTA WASAENSIAthe microscopic un
- Page 78 and 79: 78 ACTA WASAENSIA& Winker (2003) an
- Page 80 and 81: 80 ACTA WASAENSIAWe wish to obtain
- Page 82 and 83: 82 ACTA WASAENSIAindividual markets
- Page 84 and 85: 84 ACTA WASAENSIAreturn series. I l
- Page 86 and 87: 86 ACTA WASAENSIASwitches between c
- Page 88 and 89: 88 ACTA WASAENSIAfollowing necessar
- Page 90 and 91: 90 ACTA WASAENSIATable 1. Parameter
- Page 92 and 93: 92 ACTA WASAENSIAin stepwise search
- Page 94 and 95: 94 ACTA WASAENSIA0.2Logreturns Para
- Page 96 and 97: 96 ACTA WASAENSIA0.8Chartist Index
- Page 98 and 99: 98 ACTA WASAENSIATable 3. Kurtosis
- Page 100 and 101: 100 ACTA WASAENSIAthe most extreme
- Page 102 and 103: 102 ACTA WASAENSIATable 4. Estimate
- Page 104 and 105: 104 ACTA WASAENSIATable 8. Results
- Page 106 and 107: 106 ACTA WASAENSIATable 9. Results
- Page 108 and 109: 108 ACTA WASAENSIATable 11. Paramet
- Page 110 and 111: 110 ACTA WASAENSIA1 x 105 Aggr. Inv
- Page 112 and 113: 112 ACTA WASAENSIA200Aggr. Inventor
- Page 114 and 115: 114 ACTA WASAENSIA5 x 105 Aggr. Wea
- Page 116 and 117: 116 ACTA WASAENSIAOverall, we can a
- Page 118 and 119: 118 ACTA WASAENSIAby Lux (1998). Th
- Page 120 and 121: 120 ACTA WASAENSIAwhere s is a disc
- Page 122 and 123: 122 ACTA WASAENSIAprocessing valuat
- Page 124 and 125: 124 ACTA WASAENSIAProof. See append
- Page 128 and 129: 128 ACTA WASAENSIA0.4Logreturns Ass
- Page 130 and 131: 130 ACTA WASAENSIA0.4Logreturns Ass
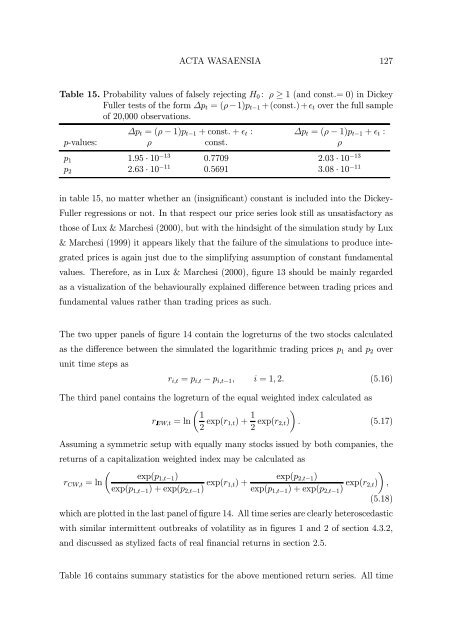
- Page 132 and 133: 132 ACTA WASAENSIATable 17. Probabi
- Page 134 and 135: 134 ACTA WASAENSIATable 18. Median
- Page 136 and 137: 136 ACTA WASAENSIAIn order to test
- Page 138 and 139: 138 ACTA WASAENSIAReferencesAbhyank
- Page 140 and 141: 140 ACTA WASAENSIABaillie, R. T. (1
- Page 142 and 143: 142 ACTA WASAENSIABlack, F. & M. Sc
- Page 144 and 145: 144 ACTA WASAENSIAButler, R. J., J.
- Page 146 and 147: 146 ACTA WASAENSIACont, R. (2001).
- Page 148 and 149: 148 ACTA WASAENSIAEmbrechts, P., C.
- Page 150 and 151: 150 ACTA WASAENSIAFielitz, B. D. (1
- Page 152 and 153: 152 ACTA WASAENSIAGhysels, E., A. C
- Page 154 and 155: 154 ACTA WASAENSIAHeston, S. L. (19
- Page 156 and 157: 156 ACTA WASAENSIAKaldor, N. (1939)
- Page 158 and 159: 158 ACTA WASAENSIALiesenfeld, R. (1
- Page 160 and 161: 160 ACTA WASAENSIALye, J. N. & V. L
- Page 162 and 163: 162 ACTA WASAENSIAMikosch, T. (2003
- Page 164 and 165: 164 ACTA WASAENSIAPindyck, R. S. (1
- Page 166 and 167: 166 ACTA WASAENSIASethi, R. (1996).
- Page 168 and 169: 168 ACTA WASAENSIATesfatsion, L. &
- Page 170 and 171: 170 ACTA WASAENSIAAAppendixA1Matlab
- Page 172 and 173: 172 ACTA WASAENSIA87 % a3 = 1; %imp
- Page 174 and 175: 174 ACTA WASAENSIA181 nmout = max([
- Page 176 and 177:
176 ACTA WASAENSIA275276 figure;277
- Page 178 and 179:
178 ACTA WASAENSIA45 end464748 % In
- Page 180 and 181:
180 ACTA WASAENSIA454647 % Check wh
- Page 182 and 183:
182 ACTA WASAENSIAA4Matlab code for
- Page 184 and 185:
184 ACTA WASAENSIA888990 % create P
- Page 186 and 187:
186 ACTA WASAENSIA4344 nobs = 500;
- Page 188 and 189:
188 ACTA WASAENSIAA6Matlab code for
- Page 190 and 191:
190 ACTA WASAENSIA9192 for t = 1:T
- Page 192 and 193:
192 ACTA WASAENSIA185 fcash = fcash
- Page 194 and 195:
194 ACTA WASAENSIA279280281 %Output
- Page 196 and 197:
196 ACTA WASAENSIA(4.20), and o(τ
- Page 198 and 199:
198 ACTA WASAENSIAas t = n k P ˙
- Page 200 and 201:
200 ACTA WASAENSIA nBn˙f2 = v B n
- Page 202 and 203:
202 ACTA WASAENSIA f˙1−c1 = v B
- Page 204 and 205:
204 ACTA WASAENSIAlocal stability o