Initial findings May 2011a - Gauteng Online
Initial findings May 2011a - Gauteng Online
Initial findings May 2011a - Gauteng Online
You also want an ePaper? Increase the reach of your titles
YUMPU automatically turns print PDFs into web optimized ePapers that Google loves.
Quality of Life in the <strong>Gauteng</strong> City-Region: 2011 <strong>findings</strong>Slides prepared by GCROteam unless otherwisestatedResults from the ‘Quality of Life’ sample survey ofresidents of the <strong>Gauteng</strong> city-region
Quick Introduction to the GCROSome illustrative projects• Some of our recent projects include:1. Facilitating the OECD Territorial Review of the GCR2. A ‘survey of surveys’ conducted by all governments in the GCR3. A project on non-racialism with the Ahmed Kathrada Foundation (nowpublished in Politikon, foreword by Kathy)4. A 3-survey 2-year tracking study of the impact of FIFA 2010 on microtraders,results presented at the ‘Sport and the City’ conference5. An interactive mapping tool allowing users to manipulate the ‘50 priorityWard’ data and generate their own maps6. The first of three books analysing Johannesburg (others to look at otherareas in GCR) from spatial perspectives7. On-going work on: risk and vulnerability; ecosystem costing and valuation;metabolic flows; poverty & inequality; conceptualising the GCR (includingearly history from 1920s onwards); trade flows within and beyond the GCR;a study of ‘peripheral’ towns in the GCR; visualisation of the GCR throughphotographs; the urban space economy; regular Data Briefs, Vignettes,newsletters and other outputs, as well as books, journal articles, and so on8. Commissioned work from academic partners at UJ, UP and elsewhere
Quality of life – sampling methodology and verification• External sampling experts used to ensure robust sample; multi-stage PPSsampling approach used, based on combination of up-to-date data sources -Lightstone 2010 DemprokeyX data (so different sample frame because Census2001 simply not possible any longer). Fieldwork by DataWorld, Field Focus andConcept Evaluations.• 2011 wards used as primary sampling unit – 507 (out of a possible 508) wardssampled in <strong>Gauteng</strong> (access in one Midvaal ward completely impossible)• Stratification was by local municipality with a minimum of 600 interviews targetedin each municipality; priority townships were oversampled with a minimum of 100interviews in each township; thereafter PPS used to allocate remaining interviews• 16729 successful interviews conducted between 15 August and 15 December2011 – 25 00 site visits required to realise this sample• Random starting point ID within ward, every 5 th stand selected for interview,birthday rule for ID respondent 18+, dice roll for multiple households per stand
Fieldwork• Many parts of <strong>Gauteng</strong> are ‘no go’ zones to researchers• Gated communities in particular demand a wide range ofID/letters/etc., all fieldworkers had badges and bibs and officialsignage (on cars etc.), but in many instances were refusedentry• This was worst in Midvaal – at one location on the Vaal,(white) fieldworkers were escorted out of a gated communityat gun-point – this after over 40 attempts to negotiate access• Mines and similar compound areas also refused entry• Research cannot proceed where local individuals or structuresor security companies decide to make their own laws andregulate entry as they see fit – this is why we have ademocratic constitution. This behaviour is reprehensible inevery way.
Land cover in <strong>Gauteng</strong> (GTI data)
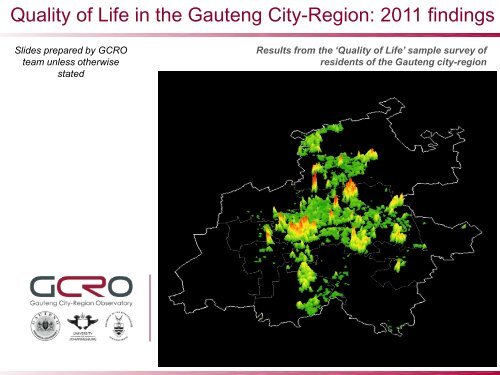
Population density in <strong>Gauteng</strong>
Sample: 17 629 respondents, error bar: 0,7%For 2011, sample was restricted to <strong>Gauteng</strong> only (Soweto inset shows distribution)
Sample points (Top 20 TS all over-sampled for later analysis)
Quality of life – sampling methodology and verification• Graph below shows number of respondents per ward. We want to get to award-representative QoL survey over time. In general, representivityrequires at least 20 to 30 respondents per ward.• In 2011, 47% of wards (237 of 507 wards), had 30 respondents or more.80% (408 of 507) had 20 respondents or more. Only 14 wards had lessthan 10 respondents• Very close, but full representivity at ward level will depend onmunicipalities co-investing in an even larger sample in 2013.100908070605040302010011223344556677889100111122133144155166177188199210221232243254265276287298309320331342353364375386397408419430441452463474485496507
Some of the maindevelopmentchallenges
Percentage with piped water in dwelling or on site, 2009 vs 2011100%90%80%94% 95% 97% 96%93%93%91%92%94% 92%93%91%92%86% 87%86%83%84%81%80%70%60%64%62%50%40%30%2009201120%10%0%
For those without piped water on site or in dwelling, is watersource more than 200m away?
Proportion of respondents with refuse NOT collected bymunicipality, 2009 vs 2011E.g. Placed on communal refuse dump, own refuse dump, burnt in pit, buried35%33%30%25%20%23%21%22%19%15%10%5%7%6%9%7%2%5%4%14%16%13%15%14%12% 12% 12%9%7%200920110%
Do people recycle? And if not, why not?
Number of refuse bags generated each week, per dwelling type100%90%80%70%60%50%40%30%20%10%4 or more2 to 3100%
Intersection between living conditions,service delivery and vulnerability of poorcommunities
Dwelling types sampled, 201112% of the respondents of the GCRO’s 2011QoL survey live in dwellings that can beconsidered below RDP standard (itemsunderlined in the legend: i.e. informal,traditional type or caravan/tent). This is just0.5% less than the 2009 sample
Informal dwelling construction materials, 2011Of the informal and similartype of dwellings sampled,the main constructionmaterial is corrugated iron,with wood, cardboard, mudand cement mixes and avariety of other materialsalso used.Construction materials generally used for building informaldwellings, in percent0.60.40.3 0.1Corrugated ironWoodConsidering that this reflectsthe main materials used, itsuggests a significantnumber of persons live indwellings that are notresistant to heavy rainfalland cannot withstand highwinds, thereby increasingtheir already vulnerablesituation10.3OtherCardboardMud and cement mixTileAsbestosPlastic
Energy use: 2009 vs 2011In the 2009 QoL survey sample, no respondents indicatedthat they used solar energy for either cooking or lighting.In the entire 2011 QoL survey of 16478 respondents therewere 7 persons that indicated that they use solar heating forcooking and 13 (0.1%) indicated that they use solar energyfor lighting. The green strategy in <strong>Gauteng</strong> is not working.?
Energy use by poor communities in 2011Percentage energy use in informal settlements, other than electricity:77% of the respondents that live inshacks in back yards and 38% thatlive in informal settlements haveaccess to electricity for lighting;this goes down to 74% and 36%respectively for cooking.PercentThe sample suggests that the mainsource of energy for cooking andlighting of those people that do notuse electricity, paraffin and gasdominate for cooking, while the useof candles prevail to providelighting.This points to vulnerability to fires,especially in informal settlements,as well as difficulty for children tostudy at night, in dimly litenvironments.0 percent line
Numbers of households sharing a toilet, 2011Of the sample, 19% of households still share a toilet withat least one other household, which highlights concerns fornot only privacy, but also health and safety, especially ofchildren and womenPercentage households in <strong>Gauteng</strong> sharing a toilet5.54.83.83.12 0.180.5123456no sharing
Dwelling ownership and tenureThe 2011 QoL sample shows a slight increase in ownership of dwellings – whether paidoff or paying a bond. The largest difference is the sharp decrease of the transfer of titledeeds for existing government houses. Of the dwellings below RDP standard, at least21% are rented informal units and 70% are informal units where no rent orownership applies.
Biggest problems facing the community: 2009 vs 2011Housing as the single biggest perceived problem decreasedsignificantly from 2009 to 2011 among the sample respondents:PercentTshwane35Lesedi302520EkurhuleniMidvaal1510Johannesburg5020092011EmfuleniMogale CityMerafong CityRandfonteinWestonaria* For evaluation purposes the 2011 municipal boundaries are used (2009 data for Kungwini and Nokeng is thus combined withthat of Tshwane); : ‘0 percent position’
Biggest problems facing the community: 2009 vs 2011Housing listed as the first and second biggest perceived problemdecreased significantly from 2009 to 2011 among respondents:PercentTshwane40Lesedi35302520EkurhuleniMidvaal1510Johannesburg5020092011EmfuleniMogale CityMerafong CityRandfonteinWestonaria
Biggest problems facing the community: 2009 vs 2011When considering service delivery as the first and second biggestperceived problem the following is apparent:Tshwane60PercentLesedi50Ekurhuleni4030Midvaal20Johannesburg10020092011EmfuleniMogale CityMerafong CityRandfonteinWestonaria
Biggest problems facing the community: 2009 vs 2011Disasters (such as drought and floods) have increased significantlysince 2009 as perceived problems – this may not reflect thenumber of actual disaster events, but heightened awareness ofthese problems.PercentTshwane15Lesedi10Ekurhuleni5Midvaal0Johannesburg-5200920112011 including firesEmfuleniMogale CityMerafong CityRandfonteinWestonaria
Transport and mobility questionsChristo Venter, University of Pretoria
Main trip purpose236 246 110725397345955WorkLook for workEducationShopServe childrenSocial/leisureOther1516Only about half of the trips people regard as their most frequenttrips are to work. Many other trips, including for shopping,school, and looking for work, are also important (yet frequentlyundervalued by transport providers and planners) – the asecondlargest category comprises people looking for work.
Mode used for main trip purposeOther9%33%50%2%3%Shopping/leisure9%28%57%2%3%Education13%32%44%5%6%Look for work6%9%73%2%9%Work6%42%42%3%5%0% 10% 20% 30% 40% 50% 60% 70% 80% 90% 100%Walk Bicycle Car/Mbike Taxi Bus/BRT Train OtherMost work trips are made by car and taxi. Taxi is a very important mode for workseekers.Taxis are also used for a variety of other purposes such as going toeducation and shopping/leisure activities.Notes: This refers to main mode, i.e. mode used for the longest distance of each trip. It does notnecessarily correlate to the overall percentage of people using a particular mode.It is likely walk trips are undercounted, as many people don’t think of it as ‘transport’, or use it for moreinfrequent trips.
Mode to work, by municipalityGAUTENG (n=5955)6%42%42%Westonaria (n=96)11%29%51%Tshwane (n=1399)4%46%40%Randfontein (n=76)5%47%41%Mogale (n=216)8%44%44%Midvaal (n=49)10%59%29%Merafong (n=143)9%36%39%Lesedi (n=44)5%34%57%Johannesburg (n=2217)7%42%42%Emfuleni (n=450)3%37%50%Ekurhuleni (n=1265)8%41%42%0% 10% 20% 30% 40% 50% 60% 70% 80% 90% 100%Walk Bicycle Car/Mbike Taxi Bus/BRT Train OtherOverall, cars and taxis carry equal numbers of people to work in <strong>Gauteng</strong>.However, mode use varies across municipalities: cars dominate in the higherincomemunicipalities of Midvaal, Tshwane, Johannesburg and Mogale City, whiletaxis dominate elsewhere.Notes: This refers to main mode, i.e. mode used for the longest distance of each trip. Caution is neededwhen interpreting data from small sample sizes.
60MetroAverage travel time60Non-Metro504043444946 474647424050404148445247433030202010100Work Look for work Shopping0Work Look for work ShoppingNon-metro (Westonaria, Merafong, Mogale, Midvaal)Ekurhuleni Johannesburg TshwaneNon-metro (Randfontein, Emfuleni, Lesedi)Travel times vary slightly across metros: Commuters in Tshwane travel longest toget to work, but shortest to shopping places. Johannesburg residents takelongest to get to shopping. Non-metro areas seem to fall into two groups: Areaswith longer travel times (including Randfontein, Emfuleni, Lesedi), and areas withshorter travel times.Notes: Caution is needed when interpreting data from small sample sizes.
School travelBus time to school bellWalk time to school bell50%50%40%30%20%10%0%50%40%30%60 minTaxi15%Bus/BRT11%Car/Mbike19%Train1%Other1%Walk51%40%30%20%10%0%50%40%30%60 minCar time to school bell20%20%10%0%60 minBicycle2%10%0%60 minAbout half of trips to school are made on foot, with car, taxi and bus/BRT ofdecreasing importance. Transport conditions require many children to leave homevery early: more than 40% of children using taxis and buses leave home morethan an hour before the bell.Notes: The question captures the time between when children leave the home and when school starts, so
Access to public transport100%4% 4% 5%12%5%11% 8% 5% 5% 6% 5%80%21%30%20%26%26%37%30%21% 25%30%23%60%40%20%75%66%75%63%68%53%62%74% 70%64%72%0%Within 10 minutes 11-30 minutes More than 30 minutesPublic transport (PT) access in <strong>Gauteng</strong> is reasonably good: overall, almost threequartersof households live within 10 minutes’ walk of a public transport service,and 95% live within a 30-minute walk (about 2 kilometers). PT access is worst inLesedi, Midvaal and Mogale City.Notes: These are based on walk times to the nearest taxi, bus or train, estimated by the respondent and
Household expenditure on transport100%80%10% of median income60%40%PT users (metro)PT users (non-metro)Car users (metro)Car users (non-metro)20%0%R 200 R 400 R 600 R 800 R 1 000 R 1 500The graph shows the % of households spending more than a certain amount ontransport monthly. Car users spend more on transport than public transport (PT)users, and metro residents spend more on transport than residents of non-metromunicipalities.However car users have much higher incomes: About 40% of metro car usersspend more than 10% of their median income on transport. This rises to 55% fornon-metro car users, and almost 80% for PT users.Notes: Median income figures are estimated only and needs to be verified further.
Satisfaction with transportWestonaria33%48%9%9%2%Tshwane17%65%8%7%4%Randfontein21%62%8%8%1%Mogale18%60%6%14%3%Midvaal31%55%6%6%2%Merafong20%66%6%7%1%Lesedi32%50%8%3%7%Johannesburg14%61%10%11%3%Emfuleni26%49%11%11%3%Ekurhuleni13%54%12%16%5%0% 10% 20% 30% 40% 50% 60% 70% 80% 90% 100%Very satisfied Satisfied Neither Dissatisfied Very dissatisfiedSatisfaction with transport, in general, is highest in Midvaal, Merafong, Lesedi, andRandfontein municipalities, despite having below average public transportcoverage and travel times. Satisfaction is lowest in Ekurhuleni, Johannesburg, andMogale City. Expectations might be different in metro and non-metro areas.
Main problems with public transport% of public transport users reporting problemUnreliabilityUnroadworthyvehiclesCrime /securityRecklessdrivingLack ofcomfortInsufficientservice atnightInsufficientservice onweekendLong walkto neareststop /stationMETRO Ekurhuleni 13% 14% 3% 12% 11% 6% 15% 1% 1% 3% 4%Johannesburg 13% 11% 3% 12% 14% 9% 14% 2% 1% 2% 4%Tshwane 16% 9% 3% 14% 12% 9% 16% 2% 1% 3% 4%Long waitat stop /stationRudedriversand / orpassengersExpensiveNON-METROEmfuleni 12% 14% 3% 15% 15% 9% 13% 2% 0% 1% 5%Lesedi 10% 5% 3% 18% 12% 14% 14% 3% 1% 2% 8%Merafong 13% 22% 3% 9% 6% 7% 12% 3% 0% 5% 7%Midvaal 9% 13% 0% 11% 4% 4% 12% 3% 3% 5% 21%Mogale 11% 11% 3% 11% 12% 8% 9% 4% 2% 4% 10%Randfontein 12% 14% 3% 12% 9% 9% 9% 3% 1% 3% 9%Westonaria 13% 11% 3% 13% 13% 7% 10% 6% 1% 3% 8%When public transport users were asked for the main problems they experience,people in the metros were more concerned with the high cost of transport, rudedrivers/passengers, and unreliable service. In non-metro areas, problems withunroadworthy vehicles, reckless driving, and rudeness dominate, consistentwith high taxi use. Most people do not consider crime and security as a majorproblem.
Economy
Monthly household income by race 2009302520151050White2009Indian2009Coloured2009African2009
Monthly household income by race 2011%30.025.020.015.010.0AfricanAsian/IndianColouredWhite• ‘No income’category up forall races• The peak forAfricans hasfallen and that forwhites hasincreased• Minor changesfor Coloured andIndians 2009-20115.00.0
Income by race 2009/2011302520151050White 2009White 2011Indian 2009Indian 2011Coloured 2009Coloured 2011African 2009African 2011
Detailed employment status, 2009 vs 20112009 2011Employed full time, formal sector 22% 20%Employed part time, formal sector 4% 4%Employed full time, informal sector 5% 4%Employed part time, informal sector 3% 3%Self employed, own business not working from home 3% 2%Self employed, own business working from home 4% 4%Unemployed & looking for work 32% 30%Unemployed, not looking for work, would accept work 2% 4%Do not want to work 1% 2%Disabled 2% 1%Housewife / home maker 2% 6%School pupil / full-time student 7% 7%Retired person / pensioner 12% 14%
Detailed employment status10090807060502009403032.829.434.533.724.130201120108.560Employed formal Employed informal unemployed other
Employment by municipality100.0%90.0%80.0%70.0%60.0%50.0%40.0%30.0%38.0%31.5% 31.4% 32.5%46.7%39.3%40.3%36.8%35.6%25.2%42.7%35.2%50.0%43.9%47.8%37.0%40.0%36.4%32.6% 33.4%42.4%36.1%32.8%39.8%2009201120.0%10.0%0.0%
Employment by race100.0%90.0%80.0%70.0%60.0%60.8%50.0%40.0%30.0%38.4%32.8%44.4%40.1%50.6%37.4%48.3%2009201120.0%10.0%0.0%African Asian/Indian Coloured White
Employment by gender100.0%90.0%80.0%70.0%60.0%54.1%50.0%40.0%30.0%42.6%33.5%30.0%2009201120.0%10.0%0.0%MaleFemale
Non-response to the income question1009080The income question has become increasingly sensitive forrespondents. More than a third of the people in each groupwere not willing to share information about their householdincome. The data should be treated with caution.702009 201160504039.444.747.7 47.93020106.729.110.420.70African Asian/Indian Coloured White
Monthly household income and level of education%3025201510Very high household income levels are stillassociated with post-matric education.NonePrimary onlySome secondaryMatricMore50
Rate of unemployment (official) over time by race (SA)These data comes from different sources (census, C’ty Survey, Labour Force Survey)but suggest that African unemployment is dropping steadily and that parity will bereached fairly soon. Sadly this is parity in unemployment, not employment.
Inequality – lower than claimed and dropping2006 2007 2008 2009 2010<strong>Gauteng</strong> 0.65 0.65 0.65 0.64 0.64Ekurhuleni 0.63 0.63 0.63 0.63 0.63Johannesburg 0.64 0.64 0.63 0.63 0.62Tshwane 0.62 0.62 0.62 0.61 0.61These figures – from Global Insight using StatsSA data– if true, suggest that current (globally repeated) claimsthat <strong>Gauteng</strong> and its cities are the most unequal onearth, are badly wrong. The recent OECD Territorialreview claimed a Gini coefficient for Johannesburg at0,73 (p.31) – these data suggest the figure is bothwrong and fails to show dropping inequality.
Hunger/povertyTotal sample comparing 2009/2011• 17% of respondents in 2009 and 20% in2011 had to skip a meal in past 12 monthsdue to lack of money to buy food• 13% of respondents in 2009 and 18% in2011 had no money to feed the children inthe household (in 12 months prior tointerview)• 5%(2009) or 6% (2011) of respondents eat1 meal per day; 26% (now 31%) eat twomeals, 62% (now down to 55%) eat threemeals a day.
Incidence of households lacking money to feed the children in 12months prior to interview (filter: households with children)302524222018191510131411141510530
Incidence of households lacking money to feed the children in 12months prior to interview302009 2011252024242221202019181715 15151414 141313 13121110105340* Tshwane 2011 figure includes older municipalities – Nokeng and Kungwini – formerly separate
Unable to feed children in 12 months prior to interviewRespondents who had children and were unable to feed them at any point during preceding 12months
‘How would you describe your household status?’Comparing 2009/2011Other/d-k27Poor3339Working class3430Middle class2427Upper class320 20 40 60 80 100
Migration & migrants
Migration to <strong>Gauteng</strong>Migrants as % of populationof <strong>Gauteng</strong>Cross border migrants as % ofall migrants into <strong>Gauteng</strong>Born in<strong>Gauteng</strong>Migratedinto<strong>Gauteng</strong>18%Fromelsewhere inSouth AfricaOutside SouthAfrica38%62%82%
Distribution of migrants in <strong>Gauteng</strong>60%50%40%30%20%10%39%25%40%31%54%37%33%26%36%50%• Significantdifferences inthe migrantpopulations ofeachmunicipality• In part reflecteconomies ofdifferentmunicipalities(e.g. mining inMerafong &Westonaria)0%
Sex of migrant pop’n: females outnumber males (except W Cape)100%90%80%70%60%52606555496554 54 52 5550%40%30%20%10%48403545513546 46 48 45FemaleMale0%
Race of population by migrant status100%90%80%70%12%16% 14%18%2%3%4%2%4%3%4%3%60%White50%40%77% 74%82% 80%Coloured30%Asian/Indian20%African10%0%Total <strong>Gauteng</strong> <strong>Gauteng</strong> born All migrants Cross bordermigrants
Origins of internal & cross border migrantsProvinces of origin ofinternal migrants (%)35%30%29%Region of origin of crossborder migrants (%)80%70%76%25%60%20%19%50%40%15%13%12% 12%30%10%5%0%9%3% 3%20%10%0%12%7%3%1% 1% 0.30%
Migration and belongingWhere do you consider tobe ‘home’21%5%<strong>Gauteng</strong>Other provinceOther country74%• 24% of respondents were notliving in <strong>Gauteng</strong> 5 years ago(20% in 2009 survey)• 62% of those who moved in thepast 5 years arrived in the past 3years (70% in 2009 survey)• 25% of those who migrated fromoutside South Africa arrivedbefore 1994• Almost three quarters of allmigrants consider <strong>Gauteng</strong> to be‘home’
Attitudes to cross border migrants & migrationAttitudes to migration policy47%21%32%SendforeignershomeLetforeignersstayOnly allowlegalforeignersAttitudes to migrants• 2.3 % identified ‘foreigners’as the biggest/secondbiggest problem facing theircommunity (0.5% 1 stmention, 1.8% 2 nd mention)– Compares to 2.7% in 2009– 18 th in importance for 1 stmention and 14 th inimportance for 2 nd mention• Attitudes to policyconsistent across all groups– BUT when asked to namebiggest problem incommunity the mosteducated, whites, Indians,and those living in informalhousing were most likely toname ‘foreigners’
Education, employment & income by migrant status• The data suggests that some commonly held views regarding education,employment & income of migrants, particularly cross border migrants maybe misplaced• All migrants are more likely to have only primary education or less (20%)compared to the <strong>Gauteng</strong> born (13%)• Cross border migrants are least likely to have matric (22%) compaared toall migrants (29%) but are more likely to have tertiary education (25%compared to 19%)• Cross border migrants are least likely to be unemployed (29%) comparedto all migrants (35%) & the <strong>Gauteng</strong> born (34%)• Private households are a significant sector of employment for all migrants(19%) and cross border migrants (21%) compared to <strong>Gauteng</strong> born (10%)• There are no significant differences in the distribution of incomes betweenmigrants and the <strong>Gauteng</strong> born suggesting that cross border migrants arenot undercutting the wages of South Africans• While 12% of residents receive remittances, 18% of the <strong>Gauteng</strong> born,23% of all migrants and 28% of cross border migrants send remittances orsupport others• Only 13% of cross border migrants receive government grants comparedto 27% of all migrants and 32% of <strong>Gauteng</strong> born respondents
Education & employment by migrant statusHighest level of educationEmployment status• Reflects access to social capital &employment in different sectorsBorn in<strong>Gauteng</strong>All migrantsto <strong>Gauteng</strong>CrossbordermigrantsNone 2% 4% 3%Someprimary 11% 16% 18%Somesecondary 33% 32% 33%Matric 31% 29% 22%More 22% 19% 25%Born in<strong>Gauteng</strong>All migrantsto <strong>Gauteng</strong>Cross bordermigrantsEmployedformal 29% 31% 37%Employedinformal 5% 9% 13%Unemployed 34% 35% 29%Other 33% 26% 21%
Employment sector by Migrant StatusOtherPublic sector/govt.Private householdCommunity, social,…Financial, insurance, real…Transport, storage,…Wholesale/retail tradeConstructionElectricity, gas, water supplyManufacturingMining & quarryingAgriculture, hunting,…Cross border migrantsAll migrants to <strong>Gauteng</strong>Born in <strong>Gauteng</strong>Total0% 5% 10% 15% 20% 25%
Income of residents by migrant statusTotalresidentsBorn in<strong>Gauteng</strong>All migrants to<strong>Gauteng</strong>Cross bordermigrants to<strong>Gauteng</strong>None 7% 7% 7% 6%R1-R3200 26% 26% 27% 24%R3201-R6400 9% 8% 10% 8%R6401-R12800 7% 7% 6% 7%R12801-R25600 5% 5% 4% 4%R25601-R51200 3% 4% 2% 1%R51201 > 2% 2% 2% 2%No response 41% 40% 43% 48%
Source of income by migrant statusSavings/investmentsRenting dwellingFriendsFamily/remittancesGovernment grants(inc. pensions)Informal employmentFormal employmentCross border migrantsAll migrants to <strong>Gauteng</strong>Born in <strong>Gauteng</strong>0% 10% 20% 30% 40% 50%
Community
‘What is the main problem facing your community?’ 09/115045403546352009 201130252320151410507 7 73 45 51 163 4 3 2 27
‘In your opinion, can a man beat a woman if she…’10090807099 98 97 97 96 9560504030NOYES20100...burns thefood1 2 3 3 4 5...refuses tohave sex withhim...goes out ...argues withwithout telling himhim...doesn’t lookafter thechildren...is unfaithful5% extrapolated to the <strong>Gauteng</strong> population is some half a million people…. It is worth noting thatof the 21 GBV shelters which exist for women in <strong>Gauteng</strong>, 19 are managed by civil society…
Attitudes to abortion%On request, 17Never, 55Under specificcirc.s (e.g. incest(,28
Sense of safety90‘Very safe’ and ‘fairly safe’ combined80702009201178787673605040302021232330100Victim of crime? Feel safe - day? Feel safe - walking atnight?Feel safe at home?
‘What is the main health problem facing your community?’6050494030282009201120161011118 7 7 864 4 4 50HIV/AIDS Alcohol Drugs High BP TB Diabetes Teen preg
Participation in various fora (2009 & 2011)45%40%35%30%25%20%15%10%5%0%41.0%37.8% 37%35.2%24.2%21%18% 18.8%13%10.6%9%6.8%20092011
Participation in various fora in past yearWardmeetingStreetCtteeResAssoc.CDF<strong>May</strong>oralimbizoCPFIDPEkhur Emf Jhb LesediMogaleMerafongMidvaalRandfonteinTshwane36.5% 44.1% 35.7% 46.3% 47.4% 30.7% 44.1% 47.5% 37.6%34.4% 37.1% 35.0% 36.0% 36.4% 25.4% 37.8% 35.8% 35.6%Weston-ariaTotal<strong>Gauteng</strong>47.9% 37.8%37.7% 35.2%23.1% 27.1% 24.6% 21.9% 22.7% 19.3% 29.2% 27.4% 23.4 26.4% 24.2%%10.2% 14.6% 10.2% 8.0% 15.0% 11.4% 12.9% 11.4% 9.6% 16.7% 10.6%17.1% 25.7% 18.5% 23.5% 25.1% 19.5% 22.8% 19.0% 17.5 25.6% 18.8%%6.4% 9.4% 6.3% 4.4% 6.5% 8.0% 9.8% 7.3% 6.8% 5.6% 6.8%
Participation in various fora in past year
Participation in various fora in past year by residents born in<strong>Gauteng</strong> and migrantsWard meeting35%40%Street Cttee/Residents Assoc.34%36%Comm. Dev. Forum23%25%School governing bodyCPF meeting21%24%18%19%Migrated to GPBorn in GP<strong>May</strong>oral imbizo11%11%IDP meeting7%7%0% 10% 20% 30% 40% 50%
Participation in the past year in CSOs 2009 & 2011CulturalCivicRatepayersPolitical partyYouthSocial/recreationalNeighbourhood watchStreet/block ctteeMens/WomensSportBurialReligious5335456656661010111210121013252355600 10 20 30 40 50 60 7020112009
Participation in CSOs by migrants & born in <strong>Gauteng</strong> in pastyearCivic assoc.Ratepayers AssocTrade UnionBusiness/prof orgCultural orgPolitical partySavings club/stokvelNeighbourhood watchMens/womens orgStreet/block ctteeSports clubChoirBurial societyChurch/religious2.22.73.63.43.13.54.24.24.64.666.57.98.78.99.99.710.51010.88.310.914.515.423.826.354.454.30 10 20 30 40 50 60MigrantBorn in GP
How residents normally find out what municipality is doing(multiple mention)Pamphlet/leafletNewspaper/magazineRadioNone of aboveIn person munic. OfficialsWard meetingWord of mouthDon't care/don't want to hearInternetSMS/mobile phone appMunicipal call centre/officeCommunity centre0 20 40 60 80 100
How residents would prefer to hear what municipality is doing (%) (multiplemention adds up to more than 100%)Pamphlet/leafletNewspaper/magazineRadioNone of aboveIn person munic. OfficialsWard meetingWord of mouthDon't care/don't want to hearInternetSMS/mobile appMunicipal call centre/officeCommunity centre0 20 40 60 80 100
Household access to communicationsTotalEkurhuleni100.0%80.0%EmfuleniWestonaria60.0%40.0%20.0%JohannesburgTshwaneRandfonteinMogale0.0%MidvaalMerafongLesediCellphoneTelevisionRadio/music systemPC/laptopLandlineInternet
Where mostly access internetOtherLibrary/community centreUniversity/college/schoolInternet caféCellphone nearly every dayCellphone not often4.7%0.7%7.0%9.1%12.8%15.4%Work29.7%Home48.8%0.0% 10.0% 20.0% 30.0% 40.0% 50.0% 60.0%
Accessing internet from cell-phone1009090 918075797781706769 69605454504646YesNo4030203331 31252123191010 9016 - 19 20 - 24 25 - 29 30 - 34 35 - 39 40 - 44 45 - 49 50 -54 55 - 59 60 - 64 65+
Values & attitudes
Blacks and whites will never really trust each other100%90%80%70%60%20 2112 1032 28 3011 17 1425194337DisagreeNeutralAgree50%172240%30%20%10%0%68 6958 55 56 5640 41We arefailing tobuild nonracialismin<strong>Gauteng</strong>
Indians do not deserve to benefit from affirmative action100Disagree90Neutral807060504030201004951675929272018221520 22African Indian Coloured WhiteAgreeNote howAfrican andwhiterespondentsleast likely todisagree,most likely toagree or sit inthe ‘neutral’category
Coloureds are helping to build the new South Africa100%Disagree90%23 2228Neutral3580%Agree70%60%50%40%30%20%10%0%2127302957513642African Indian Coloured WhiteWhen thequestion isaboutcoloureds,Indians andAfricans arehostile whilewhites supportas playing apositive role inSA
‘No-one cares about people like me’(Alienation by race, ‘don’t know’/neutral not shown)40 38373635Agree Agree '1134373025242320191514151050African Coloured Indian White Total
The country is going in the right direction 09/11706050403020100622919596654 5423202121African Coloured Indian White Total604217396559272260Question wasasked in thepositive (‘countrygoing rightdirection) in 2009,reversed (‘wrongdirection’) 2011,which mayaccount for someof the dramaticshift – but mood isvery, very lowright now.Agree 2009Agree 2011Disagree 2009Disagree 2011
‘People like me cannot influence developments in my cty’(Anomie by race, ‘don’t know’/neutral not shown; increases across the board)706360535351515048454647424039 3836 3735303029 2925 2620Agree 2009Agree 2011Disagree 2009Disagree 2011100African Coloured Indian White Total
‘Corruption is main threat to our democracy’60504030201005148494840 4136 363733989 1011Strongly agree Agree Neutral Disagree Stronglydisagree6655711101TotalAfricanColouredIndianWhite
‘The judiciary is free from govt. influence’(By race, ‘don’t know’ not shown; skepticism re judiciary dropping)504645 44434142 42414039 39 39353635353431 3130312930 3030272828 282624252523212015AgreeAgree '11DisagreeDisagree '11NeutralNeutral '111050African Coloured Indian White Total
Satisfaction (or not!) with government 09/116057Satisfied 09504039375044404048Satisfied '11Neither 09Neither '11Dissatsfied 093034 3329Dissatisfied '112019192421 222019100National Provincial Local govt
Government
Batho Pele• 14% of sample had tried contacting a govt. dept.– African residents (13%) & people in informal housing(10%) were least likely to have made contact• Of those who had made contact only 57% weresatisfied with the response (71% in 2009)– Coloured (69%) & white residents (62%) were most likelyto be satisfied with the response– People in informal housing were least likely to be satisfied(41%)• 13% of migrants had made contact with agovernment department and 54% were satisfied withthe response
Batho Pele & CorruptionBatho Pele• Only 19% believe publicservants act according toBatho Pele principles(explained to respondent)down from 27% in 2009• Only 16% of residents ininformal settlements &Asian/Indian respondentsbelieve public servants actaccording to Batho Peleprinciples• 51% do not think publicservants act according toBatho Pele (57% in 2009) –remainder do not interactCorruption• 10% had ever been askedto pay a bribe by a publicservant• 8% of Africans, 16% ofAsian/Indians and 18% ofwhites had been asked for abribe• Women were least likely tohave been asked for a bribe(7%) compared to 13% ofmen• Migrants were not morelikely to have been asked topay a bribe than nonmigrants
Leisure time, recreation and relaxationin the GCR
Satisfaction with amenities: results from the 2011 QoL survey by RaceIs there general apathy with regards to the utilisation ofcultural/open spaces recreation areas? – Not surprisingconsidering that the 2009 survey found that some of the mainrecreation areas were Malls (80%) and Restaurants/clubs (45%)The option ‘N/A’ (not applicable)indicate resources that are notgenerally utilised
Satisfaction with amenities: results from the 2011 QoL survey by RaceOther races ‘average’utilisation(1 of 4)
Satisfaction with amenities: results from the 2011 QoL survey by RaceAfrican utilisationOther races ‘average’utilisation(2 of 4)
Satisfaction with amenities: results from the 2011 QoL survey by Race(3 of 4)
Satisfaction with amenities: results from the 2011 QoL survey by RaceWhites satisfactionOther races ‘average’satisfaction(4 of 4)
Quality of Life
QoL dimensions – means (2009/2011)20110.420.480.580.530.640.640.690.780.780.72WorkSocio-politicalSecurityGlobalConnectivity20090.430.530.560.560.620.650.70.710.780.72CommunityFamilyDwellingInfrastructureHealth0 0.2 0.4 0.6 0.8 1
Overall Quality of Life indexThe GCR wasin the midst ofthe globaleconomiccrisis in 2009but hasweathered thestorm well,with overall(average) QoLrising from6.24 to 6.25
2009 mean: 6.24 2011 mean: 6.25
QoL means by municipality5.776.106.216.226.226.276.326.336.426.45WestonariaEkurhuleniEmfuleniMogale CityMerafong CityLesediJohannesburgTshwaneMidvaalRandfontein5.40 5.60 5.80 6.00 6.20 6.40 6.60
Tentative conclusionso This is a first analysis of the data, and far deeper analysis is required – and willbe forthcomingo Mood is very low. This is natural between elections, as part of national (andprovincial and local) mood cycles, but equally clearly, there is a substantial loss offaith in politicians and a belief that corruption is the biggest threat facingdemocracy in <strong>Gauteng</strong>o Delivery looks very positive, if uneven across municipalities. Delivery of servicescan always be improved; but – despite the rash of protests – does not seem to bea major problem for GPG.o What we seem to be missing is ‘the ghost in the machine’, the energy or spiritor vision that holds together our varied and cosmopolitan population behind andin support of GPG. The domains pulling down quality of life are work (or lackof…), family, socio-political sense and ‘global’ – that all-round sense that theworld is well, my world is well, and things will get better – that hope and optimismis what the survey has battled to find, and in its place we find deep hostility topolitics, dissatisfaction with government (all spheres), and a replacement of faithin the judiciary (which took a hit in 2009)o Clearly, we face challenges – but they are of the more intangible, less easy toresolve, type. Delivery alone may not be the answer.
• Thank you


