united-utilities-annual-report-2015
united-utilities-annual-report-2015
united-utilities-annual-report-2015

You also want an ePaper? Increase the reach of your titles
YUMPU automatically turns print PDFs into web optimized ePapers that Google loves.
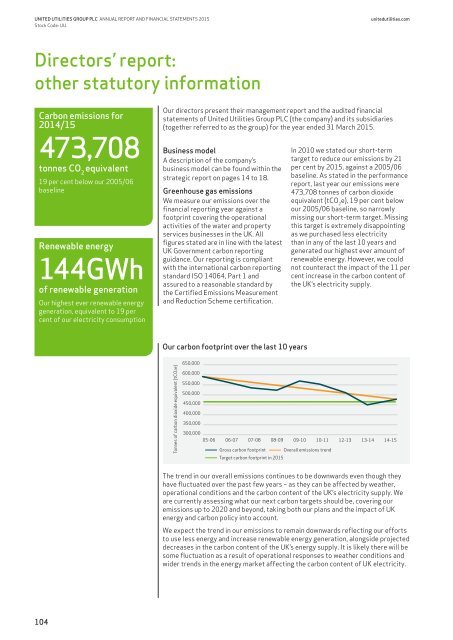
UNITED UTILITIES GROUP PLC ANNUAL REPORT AND FINANCIAL STATEMENTS <strong>2015</strong>Stock Code: UU.<strong>united</strong><strong>utilities</strong>.comDirectors’ <strong>report</strong>:other statutory informationCarbon emissions for2014/15473,708tonnes CO 2equivalent19 per cent below our 2005/06baselineRenewable energy144GWhof renewable generationOur highest ever renewable energygeneration, equivalent to 19 percent of our electricity consumptionOur directors present their management <strong>report</strong> and the audited financialstatements of United Utilities Group PLC (the company) and its subsidiaries(together referred to as the group) for the year ended 31 March <strong>2015</strong>.Business modelA description of the company’sbusiness model can be found within thestrategic <strong>report</strong> on pages 14 to 18.Greenhouse gas emissionsWe measure our emissions over thefinancial <strong>report</strong>ing year against afootprint covering the operationalactivities of the water and propertyservices businesses in the UK. Allfigures stated are in line with the latestUK Government carbon <strong>report</strong>ingguidance. Our <strong>report</strong>ing is compliantwith the international carbon <strong>report</strong>ingstandard ISO 14064, Part 1 andassured to a reasonable standard bythe Certified Emissions Measurementand Reduction Scheme certification.In 2010 we stated our short-termtarget to reduce our emissions by 21per cent by <strong>2015</strong>, against a 2005/06baseline. As stated in the performance<strong>report</strong>, last year our emissions were473,708 tonnes of carbon dioxideequivalent (tCO 2e), 19 per cent belowour 2005/06 baseline, so narrowlymissing our short-term target. Missingthis target is extremely disappointingas we purchased less electricitythan in any of the last 10 years andgenerated our highest ever amount ofrenewable energy. However, we couldnot counteract the impact of the 11 percent increase in the carbon content ofthe UK’s electricity supply.Our carbon footprint over the last 10 yearsTonnes of carbon dioxide equivalent (tCO2e)650,000600,000550,000500,000450,000400,000350,000300,00005-06 06-07 07-08 08-09 09-10 10-11 12-13 13-14 14-15Gross carbon footprintTarget carbon footprint in <strong>2015</strong>Overall emissions trendThe trend in our overall emissions continues to be downwards even though theyhave fluctuated over the past few years – as they can be affected by weather,operational conditions and the carbon content of the UK’s electricity supply. Weare currently assessing what our next carbon targets should be, covering ouremissions up to 2020 and beyond, taking both our plans and the impact of UKenergy and carbon policy into account.We expect the trend in our emissions to remain downwards reflecting our effortsto use less energy and increase renewable energy generation, alongside projecteddecreases in the carbon content of the UK’s energy supply. It is likely there will besome fluctuation as a result of operational responses to weather conditions andwider trends in the energy market affecting the carbon content of UK electricity.104