Limer LMC, Assessment Calculations for C-14 Labelled Gas and ...
Limer LMC, Assessment Calculations for C-14 Labelled Gas and ...
Limer LMC, Assessment Calculations for C-14 Labelled Gas and ...

You also want an ePaper? Increase the reach of your titles
YUMPU automatically turns print PDFs into web optimized ePapers that Google loves.
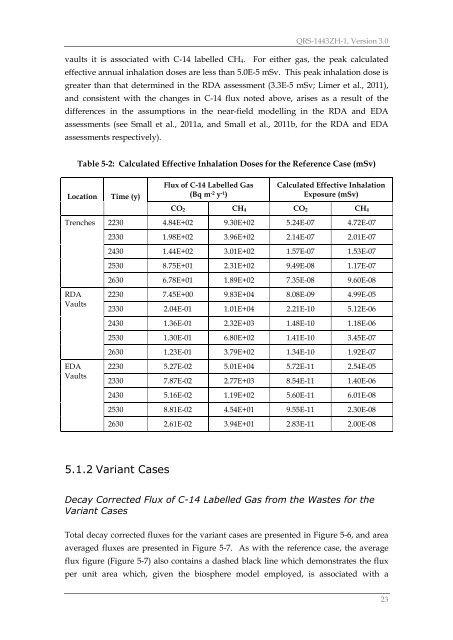
QRS-<strong>14</strong>43ZH-1, Version 3.0vaults it is associated with C-<strong>14</strong> labelled CH 4. For either gas, the peak calculatedeffective annual inhalation doses are less than 5.0E-5 mSv. This peak inhalation dose isgreater than that determined in the RDA assessment (3.3E-5 mSv; <strong>Limer</strong> et al., 2011),<strong>and</strong> consistent with the changes in C-<strong>14</strong> flux noted above, arises as a result of thedifferences in the assumptions in the near-field modelling in the RDA <strong>and</strong> EDAassessments (see Small et al., 2011a, <strong>and</strong> Small et al., 2011b, <strong>for</strong> the RDA <strong>and</strong> EDAassessments respectively).Table 5-2: Calculated Effective Inhalation Doses <strong>for</strong> the Reference Case (mSv)LocationTime (y)Flux of C-<strong>14</strong> <strong>Labelled</strong> <strong>Gas</strong>(Bq m -2 y -1 )Calculated Effective InhalationExposure (mSv)CO 2 CH 4 CO 2 CH 4TrenchesRDAVaultsEDAVaults2230 4.84E+02 9.30E+02 5.24E-07 4.72E-072330 1.98E+02 3.96E+02 2.<strong>14</strong>E-07 2.01E-072430 1.44E+02 3.01E+02 1.57E-07 1.53E-072530 8.75E+01 2.31E+02 9.49E-08 1.17E-072630 6.78E+01 1.89E+02 7.35E-08 9.60E-082230 7.45E+00 9.83E+04 8.08E-09 4.99E-052330 2.04E-01 1.01E+04 2.21E-10 5.12E-062430 1.36E-01 2.32E+03 1.48E-10 1.18E-062530 1.30E-01 6.80E+02 1.41E-10 3.45E-072630 1.23E-01 3.79E+02 1.34E-10 1.92E-072230 5.27E-02 5.01E+04 5.72E-11 2.54E-052330 7.87E-02 2.77E+03 8.54E-11 1.40E-062430 5.16E-02 1.19E+02 5.60E-11 6.01E-082530 8.81E-02 4.54E+01 9.55E-11 2.30E-082630 2.61E-02 3.94E+01 2.83E-11 2.00E-085.1.2 Variant CasesDecay Corrected Flux of C-<strong>14</strong> <strong>Labelled</strong> <strong>Gas</strong> from the Wastes <strong>for</strong> theVariant CasesTotal decay corrected fluxes <strong>for</strong> the variant cases are presented in Figure 5-6, <strong>and</strong> areaaveraged fluxes are presented in Figure 5-7. As with the reference case, the averageflux figure (Figure 5-7) also contains a dashed black line which demonstrates the fluxper unit area which, given the biosphere model employed, is associated with a23