"Scuba rice" - adron.sr
"Scuba rice" - adron.sr
"Scuba rice" - adron.sr

You also want an ePaper? Increase the reach of your titles
YUMPU automatically turns print PDFs into web optimized ePapers that Google loves.
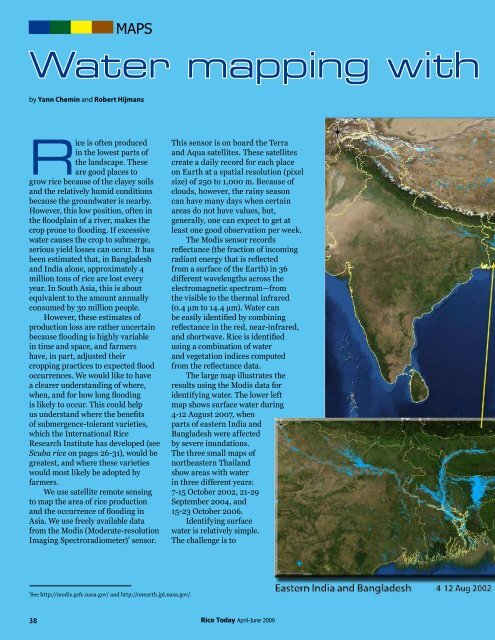
MapsWater mapping with satellitesby Yann Chemin and Robert HijmansRice is often producedin the lowest parts ofthe landscape. Theseare good places togrow rice because of the clayey soilsand the relatively humid conditionsbecause the groundwater is nearby.However, this low position, often inthe floodplain of a river, makes thecrop prone to flooding. If excessivewater causes the crop to submerge,serious yield losses can occur. It hasbeen estimated that, in Bangladeshand India alone, approximately 4million tons of rice are lost everyyear. In South Asia, this is aboutequivalent to the amount annuallyconsumed by 30 million people.However, these estimates ofproduction loss are rather uncertainbecause flooding is highly variablein time and space, and farmershave, in part, adjusted theircropping practices to expected floodoccurrences. We would like to havea clearer understanding of where,when, and for how long floodingis likely to occur. This could helpus understand where the benefitsof submergence-tolerant varieties,which the International RiceResearch Institute has developed (see<strong>Scuba</strong> rice on pages 26-31), would begreatest, and where these varietieswould most likely be adopted byfarmers.We use satellite remote sensingto map the area of rice productionand the occurrence of flooding inAsia. We use freely available datafrom the Modis (Moderate-resolutionImaging Spectroradiometer) 1 sensor.This sensor is on board the Terraand Aqua satellites. These satellitescreate a daily record for each placeon Earth at a spatial resolution (pixelsize) of 250 to 1,000 m. Because ofclouds, however, the rainy seasoncan have many days when certainareas do not have values, but,generally, one can expect to get atleast one good observation per week.The Modis sensor record<strong>sr</strong>eflectance (the fraction of incomingradiant energy that is reflectedfrom a surface of the Earth) in 36different wavelengths across theelectromagnetic spectrum—fromthe visible to the thermal infrared(0.4 µm to 14.4 µm). Water canbe easily identified by combiningreflectance in the red, near-infrared,and shortwave. Rice is identifiedusing a combination of waterand vegetation indices computedfrom the reflectance data.The large map illustrates theresults using the Modis data foridentifying water. The lower leftmap shows surface water during4-12 August 2007, whenparts of eastern India andBangladesh were affectedby severe inundations.The three small maps ofnortheastern Thailandshow areas with waterin three different years:7-15 October 2002, 21-29September 2004, and15-23 October 2006.Identifying surfacewater is relatively simple.The challenge is tointegrate it with data on rice plantingand development to see where fieldsget submerged, and during whichstage of crop development. We arealso trying to identify areas wherefarmers delay planting until the riskof submergence has diminished.The availability of free dailysatellite images, and algorithmsimplemented in open-source softwarefor geographic data analysis, suchas GRASS and R, allows us to usesatellite technology to map riceareas and some of the constraintsthat farmers have to deal with. Inthe future, we also plan to estimateyield loss caused by drought.Dr. Chemin is a postdoctoral fellowand Dr. Hijmans is a geographer inthe IRRI Social Sciences Division.1See http://modis.gsfc.nasa.gov/ and http://onearth.jpl.nasa.gov/.38 Rice Today April-June 2009 Rice Today April-June 2009 39