Rexam Investor Seminar on European Beverage Cans, 27 ...
Rexam Investor Seminar on European Beverage Cans, 27 ...
Rexam Investor Seminar on European Beverage Cans, 27 ...

Create successful ePaper yourself
Turn your PDF publications into a flip-book with our unique Google optimized e-Paper software.
<str<strong>on</strong>g>Investor</str<strong>on</strong>g> <str<strong>on</strong>g>Seminar</str<strong>on</strong>g><br />
<strong>Beverage</strong> <strong>Cans</strong> in Europe<br />
<strong>27</strong> November 2007
Leslie Van de Walle<br />
Chief Executive Officer
Leslie Van de Walle<br />
Introducti<strong>on</strong><br />
Bill Barker<br />
Capex & Innovati<strong>on</strong><br />
Tomas Sjölin<br />
<strong>Beverage</strong> cans in Europe<br />
Leslie Van de Walle<br />
C<strong>on</strong>cluding remarks<br />
Q&A<br />
Today's agenda<br />
3
Strategic objectives<br />
• Build a global, well positi<strong>on</strong>ed, beverage can and rigid plastics<br />
business through organic growth and acquisiti<strong>on</strong>s<br />
• Strengthen positi<strong>on</strong> in existing markets and increase presence in<br />
emerging markets<br />
• Develop best in class innovati<strong>on</strong> and be the packaging soluti<strong>on</strong><br />
provider of choice for local and global brand owners<br />
• Lead the industry in terms of executi<strong>on</strong> and operati<strong>on</strong>al excellence<br />
• Optimise capital structure to support <strong>on</strong>going operati<strong>on</strong>s, finance<br />
growth opportunities and deliver dividend growth<br />
Our visi<strong>on</strong>: to be the leading global c<strong>on</strong>sumer packaging company<br />
4
REXAM SALES<br />
BEVERAGE<br />
CANS<br />
70%<br />
PLASTIC<br />
PACKAGING<br />
30%<br />
Balanced portfolio of products<br />
GEOGRAPHY<br />
North<br />
America<br />
Europe<br />
Emerging<br />
Markets<br />
Healthcare<br />
Closures<br />
Pers<strong>on</strong>al Care<br />
GROWTH<br />
PROFILE<br />
- 3% to +3%<br />
+ 6% to +8%<br />
+ 8% to +10%<br />
+ 6% to +8%<br />
+3% to +4%<br />
+2% to +3%<br />
A defensive growth business<br />
TYPICAL REXAM<br />
MARGINS<br />
c. 12%<br />
(excluding passthrough)<br />
13%<br />
to 15%<br />
5
Bill Barker<br />
Group Director <strong>Beverage</strong> <strong>Cans</strong>
• Better beverage<br />
integrity<br />
• Carb<strong>on</strong>ati<strong>on</strong> retenti<strong>on</strong><br />
• L<strong>on</strong>g shelf-life<br />
• Filling and distributi<strong>on</strong><br />
ec<strong>on</strong>omics<br />
• 100% recyclable<br />
Superior form of packaging<br />
7
<str<strong>on</strong>g>Rexam</str<strong>on</strong>g><br />
Ball<br />
24%<br />
Source: Global <strong>Beverage</strong> can market volume 2006, <str<strong>on</strong>g>Rexam</str<strong>on</strong>g> estimates<br />
The leader in beverage cans<br />
<str<strong>on</strong>g>Rexam</str<strong>on</strong>g><br />
#1<br />
Crown<br />
Local players<br />
<str<strong>on</strong>g>Rexam</str<strong>on</strong>g> #1<br />
8
Europe 1<br />
Market growth 2006 c.10%<br />
45%<br />
With leading positi<strong>on</strong>s in growing regi<strong>on</strong>s<br />
<str<strong>on</strong>g>Rexam</str<strong>on</strong>g> #1<br />
South America 2<br />
Market growth 2006 c.10%<br />
<str<strong>on</strong>g>Rexam</str<strong>on</strong>g> #1<br />
63%<br />
<str<strong>on</strong>g>Rexam</str<strong>on</strong>g> Ball Crown Others<br />
North America 3<br />
Market growth 2006 c.2%<br />
<str<strong>on</strong>g>Rexam</str<strong>on</strong>g> #3<br />
24%<br />
1. Source: 2006 Global figures. <strong>Beverage</strong> Western can market and volume Eastern 2006, <str<strong>on</strong>g>Rexam</str<strong>on</strong>g> Europe estimates including Russia. Source: BCME and <str<strong>on</strong>g>Rexam</str<strong>on</strong>g> estimates 2. 2006 figures. Source:<br />
Abralatas and <str<strong>on</strong>g>Rexam</str<strong>on</strong>g> estimates 3. 2006 figures. United States and Canada. Source: CMI and <str<strong>on</strong>g>Rexam</str<strong>on</strong>g> estimates<br />
9
Performance<br />
The evoluti<strong>on</strong> of beverage cans at <str<strong>on</strong>g>Rexam</str<strong>on</strong>g><br />
Mature base<br />
New geographies<br />
New beverage categories<br />
Time<br />
New products<br />
10
A global market with healthy growth rates<br />
Growth rates 2006<br />
North America 2%<br />
Europe 10%<br />
Emerging Markets 10%<br />
Global Growth 5%<br />
1. 2006 figures. United States and Canada. Source: CMI and <str<strong>on</strong>g>Rexam</str<strong>on</strong>g> estimates 2. 2006 figures. Western and Eastern Europe<br />
including Russia. Source: BCME and <str<strong>on</strong>g>Rexam</str<strong>on</strong>g> estimates 3. 2006 figures for South America. Source: Abralatas and <str<strong>on</strong>g>Rexam</str<strong>on</strong>g> estimates11
United States<br />
Per capita<br />
c<strong>on</strong>sumpti<strong>on</strong> pa:<br />
365 cans<br />
115bn<br />
The global can market in 2006 c. 230bn<br />
15bn<br />
Brazil<br />
Per capita<br />
c<strong>on</strong>sumpti<strong>on</strong> pa:<br />
60 cans<br />
45bn<br />
10bn<br />
10bn<br />
Western Europe<br />
Per capita<br />
c<strong>on</strong>sumpti<strong>on</strong> pa:<br />
75 cans<br />
25bn<br />
10bn<br />
Rest of World<br />
Per capita<br />
c<strong>on</strong>sumpti<strong>on</strong> pa:<br />
15 cans<br />
Source: CMI, BCME, Abralatas and <str<strong>on</strong>g>Rexam</str<strong>on</strong>g> estimates 12
<str<strong>on</strong>g>Rexam</str<strong>on</strong>g> <strong>Beverage</strong> Can and End plants<br />
Joint ventures<br />
Our plants are where customers need them<br />
Manufacturing c.55+ billi<strong>on</strong> cans p.a.<br />
13
Our geographic footprint is a strategic advantage<br />
• Lower shipping costs<br />
• Use exports to build presence<br />
before investment<br />
• Optimise shipments during<br />
peak demand<br />
14
Carefully manage capacity to demand<br />
15
• Capex Objectives<br />
Investing for profitable growth<br />
• Capture growth in existing and emerging markets<br />
• Help customers expand globally<br />
• Develop new product lines<br />
• Lower costs<br />
• High return <strong>on</strong> invested capital<br />
•Focus <strong>on</strong> Executi<strong>on</strong><br />
• Skilled pool of experienced professi<strong>on</strong>als executing projects<br />
globally<br />
• Able to leverage equipment suppliers to ensure timely delivery<br />
of equipment<br />
• Minimise start-up costs<br />
16
New<br />
specialty can<br />
line<br />
Whitehouse New Cap Can<br />
New end<br />
plant<br />
Manaus<br />
Already running<br />
Running by end 2007<br />
Running 2008<br />
Running 2009<br />
New line<br />
La Selva<br />
Capex in beverage cans around the globe<br />
line<br />
Elk Grove<br />
New can<br />
plant<br />
Fredericia<br />
New plant<br />
Cuiabá<br />
Jacarei<br />
re-opened<br />
New line<br />
Moscow<br />
2nd line<br />
Egypt<br />
New<br />
plant Austria<br />
New can<br />
plant<br />
Chelyabinsk<br />
New can<br />
plant<br />
India JV<br />
Additi<strong>on</strong>al capex to support increased growth opportunities<br />
3 rd Line<br />
17
£m<br />
New Plants<br />
- Austria<br />
-Russia<br />
-Denmark<br />
New Lines<br />
-Russia<br />
- Spain<br />
- Egypt<br />
End capacity<br />
Current major<br />
projects<br />
<str<strong>on</strong>g>Rexam</str<strong>on</strong>g> capacity in Europe to increase by 5.8bn by 2009<br />
2006<br />
6<br />
-<br />
-<br />
6<br />
-<br />
0<br />
3<br />
15<br />
2007<br />
40<br />
30<br />
0<br />
10<br />
15<br />
10<br />
8<br />
113<br />
2008<br />
20<br />
5<br />
38<br />
0<br />
15<br />
12<br />
20<br />
110<br />
Outer<br />
years<br />
-<br />
-<br />
40<br />
-<br />
-<br />
-<br />
-<br />
40<br />
Total<br />
Project<br />
cost<br />
66<br />
35<br />
78<br />
16<br />
30<br />
22<br />
31<br />
<strong>27</strong>8<br />
New<br />
capacity<br />
(units)<br />
2,000m<br />
800m<br />
1,600m<br />
200m<br />
600m<br />
600m<br />
n.a.<br />
5,800m<br />
18
<strong>Cans</strong> (billi<strong>on</strong>s of units)<br />
60<br />
50<br />
40<br />
30<br />
20<br />
10<br />
0<br />
Market dynamics carefully m<strong>on</strong>itored<br />
Europe <strong>Beverage</strong> Can Market (excl Russia and Egypt)<br />
Utilisati<strong>on</strong><br />
Market Demand<br />
2007 2008 2009 2010<br />
Existing Capacity<br />
Source 2006 BCME, <str<strong>on</strong>g>Rexam</str<strong>on</strong>g> estimates and company announcements<br />
100%<br />
90%<br />
80%<br />
70%<br />
60%<br />
50%<br />
40%<br />
30%<br />
20%<br />
10%<br />
New <str<strong>on</strong>g>Rexam</str<strong>on</strong>g> Capacity Competitors New Capacity<br />
0%<br />
Capacity Utilisati<strong>on</strong><br />
19
Product Development<br />
Driving profitable growth
Value<br />
of<br />
Packaging<br />
Evoluti<strong>on</strong> of beverage packaging<br />
Returnable Glass<br />
Market Development<br />
Specialty <strong>Cans</strong>*<br />
One way glass<br />
<strong>Cans</strong><br />
Specialty <strong>Cans</strong>* are n<strong>on</strong> standard sizes. In Europe standard sizes are 330cl, 440cl 500cl and in North America the standard size is12oz 21<br />
PET
• New means different<br />
• Better prices and margins<br />
• Close relati<strong>on</strong>ship with<br />
sales/marketing, as well as<br />
procurement<br />
• Source of organic growth and<br />
competitive advantage<br />
The need for innovati<strong>on</strong><br />
...while focusing <strong>on</strong> efficiencies and operati<strong>on</strong>al excellence<br />
22
We are already benefiting from new products<br />
• New <str<strong>on</strong>g>Rexam</str<strong>on</strong>g> SLEEK™ line<br />
launched<br />
• <str<strong>on</strong>g>Rexam</str<strong>on</strong>g> Cap Can™<br />
launched<br />
• <str<strong>on</strong>g>Rexam</str<strong>on</strong>g> King Can ™<br />
• Growth in specialty sizes<br />
• Commercialising further<br />
re-sealability opti<strong>on</strong>s<br />
• Differentiated ends<br />
23
C<strong>on</strong>sumer Trends<br />
• On-the-go c<strong>on</strong>sumpti<strong>on</strong><br />
•C<strong>on</strong>venience<br />
• Health/Diet/Nutriti<strong>on</strong><br />
focused<br />
• “Identity” related snack<br />
purchase<br />
• Need for excitement<br />
• Diverse, flavor varieties<br />
(no l<strong>on</strong>ger loyal to 1 brand)<br />
• Minority growth fuels diversity<br />
C<strong>on</strong>sumer insights driving developments<br />
<strong>Beverage</strong> Pack Requirements<br />
• Fast, c<strong>on</strong>venient<br />
• Re-sealable<br />
• Easy to c<strong>on</strong>sume<br />
• Easy to hold<br />
• Good looking<br />
• Ready mixed<br />
• Porti<strong>on</strong>ability<br />
• Innovati<strong>on</strong>, new<br />
products<br />
• Able to build brands<br />
and categories<br />
24
•Energy drinks<br />
• Ice Teas and Juices<br />
• Flavoured waters<br />
• Sports drinks<br />
• Health drinks<br />
Fast growing areas<br />
25
Features/ Value Add<br />
Standard <strong>Cans</strong><br />
Innovati<strong>on</strong> to drive profitable growth<br />
Slim<br />
New<br />
Formats<br />
Straight-walled<br />
Bottles<br />
New end formats<br />
Past Present<br />
Future<br />
Custom Bottles<br />
and Products<br />
26
• Investing for profitable<br />
growth<br />
• Alignment with<br />
customer/c<strong>on</strong>sumer needs<br />
• Innovative products<br />
• Robust pricing<br />
Strengthening our #1 positi<strong>on</strong><br />
Underpinned by a relentless focus <strong>on</strong> operati<strong>on</strong>al excellence<br />
<strong>27</strong>
Tomas Sjölin<br />
Sector Director <strong>Beverage</strong> <strong>Cans</strong><br />
Europe & Asia
Margins/pricing<br />
Customer relati<strong>on</strong>ships<br />
Growth capex<br />
Innovati<strong>on</strong><br />
Operati<strong>on</strong>al excellence<br />
Strategic objective<br />
Profitable Growth<br />
29
100%<br />
80%<br />
60%<br />
40%<br />
20%<br />
0%<br />
2006 2007 2008<br />
C<strong>on</strong>tract structure in Europe<br />
Pass<br />
Through<br />
Minimal exposure to metal price volatility<br />
Metal exposure<br />
covered by existing<br />
hedges<br />
Majority of c<strong>on</strong>tracts<br />
already signed and<br />
metal exposure<br />
hedged back to back<br />
30
2000 35.5bn<br />
2006 45.5 bn<br />
2000 - 06 +4.7% CAGR<br />
Excl Germany +7.5% CAGR<br />
Source: BCME and <str<strong>on</strong>g>Rexam</str<strong>on</strong>g> estimates<br />
<strong>European</strong> can market growth<br />
2007F 49.2bn<br />
2006 – 07F +8.1% CAGR<br />
Excl Germany +8.1% CAGR<br />
Future growth<br />
+ 6% to 8%<br />
31
CSD<br />
Category<br />
Energy<br />
Drinks<br />
Sources of <strong>European</strong> growth in 2006<br />
Alcohol<br />
Category/<br />
Beer<br />
32
CEE<br />
CIS*<br />
Iberia<br />
W Europe<br />
(Excl. Germany, Iberia & UK/Ire)<br />
Germany<br />
UK & IRE<br />
<strong>European</strong> can market: sources of growth<br />
Growth Rate 2006<br />
5%<br />
4%<br />
9%<br />
8%<br />
15%<br />
29%<br />
0% 20% 40%<br />
Total growth in 2006 +10%<br />
2.9<br />
8.1<br />
Volume 2006<br />
18.2<br />
45.5bn units<br />
Source: BCME *includes Russia 33<br />
4.9<br />
4.4<br />
7
7%<br />
9%<br />
11%<br />
17%<br />
-20% -15% -10% -5% 0% 5% 10% 15% 20%<br />
Source: BCME and <str<strong>on</strong>g>Rexam</str<strong>on</strong>g> estimates<br />
Beer/FABs – Growth throughout the regi<strong>on</strong> (2006)<br />
UK & IRE<br />
Iberia<br />
Germany<br />
Rest of W Europe<br />
CIS<br />
CEE<br />
14%<br />
25%<br />
Europe +12.9%<br />
+375<br />
+252<br />
+250<br />
+467<br />
+515<br />
+811<br />
34
CSDs – Eastern Europe driving growth (2006)<br />
UK & IRE<br />
Iberia<br />
Germany<br />
-2%<br />
-20% -15% -10% -5% 0% 5% 10% 15% 20%<br />
Source: BCME and <str<strong>on</strong>g>Rexam</str<strong>on</strong>g> estimates<br />
Rest of W Europe<br />
CIS<br />
CEE<br />
-11%<br />
8%<br />
10%<br />
9%<br />
+55%<br />
Europe +7.6%<br />
-65<br />
+353<br />
-110<br />
+1,033<br />
+79<br />
+285<br />
35
• Beer and CSD growth in Eastern Europe<br />
• Str<strong>on</strong>g growth of functi<strong>on</strong>al drinks (incl.<br />
energy drinks)<br />
• Increased at-home beer c<strong>on</strong>sumpti<strong>on</strong> in<br />
West Europe<br />
• Flattening CSD c<strong>on</strong>sumpti<strong>on</strong> in West Europe<br />
• All customers looking to differentiate their<br />
product (c<strong>on</strong>cept, ingredients & packaging)<br />
Sources: Datam<strong>on</strong>itor, Zenith Internati<strong>on</strong>al, GNPD and The Henley Centre<br />
Major market trends<br />
36
illi<strong>on</strong>s of units<br />
5<br />
4.5<br />
4<br />
3.5<br />
3<br />
2.5<br />
2<br />
1.5<br />
1<br />
0.5<br />
0<br />
Growth in specialty can sales<br />
2001 2002 2003 2004 2005 2006<br />
Specialty <strong>Cans</strong>* are n<strong>on</strong> standard sizes. In Europe standard sizes are 330cl, 440cl 500cl and in North America the standard size is12oz 37
Specialty cans, more than just energy drinks<br />
Case study: Russia - Baltika 1L cans<br />
• Beer in PET has been successful in Russia<br />
• <str<strong>on</strong>g>Rexam</str<strong>on</strong>g> developed a new 1L can to meet<br />
c<strong>on</strong>sumer needs<br />
• Successfully introduced in Q2 2007<br />
• New packaging has improved brand image,<br />
quality and shelf life<br />
• Demand now out-performing capacity<br />
38
<str<strong>on</strong>g>Rexam</str<strong>on</strong>g>’s existing plants<br />
New <str<strong>on</strong>g>Rexam</str<strong>on</strong>g> Line or Plant<br />
Crown<br />
Can-Pack<br />
Ball<br />
Rostar<br />
<strong>Beverage</strong> can manufacturing landscape in Europe<br />
<str<strong>on</strong>g>Rexam</str<strong>on</strong>g> has<br />
45% market<br />
share in<br />
Europe<br />
39
Markets<br />
Different growth drivers around the regi<strong>on</strong><br />
Key growth drivers<br />
Nordics Easing regulatory envir<strong>on</strong>ment & pack mix<br />
Spain Favourable customer & c<strong>on</strong>sumer dynamics<br />
Rest of W. Europe Increased at home c<strong>on</strong>sumpti<strong>on</strong> & energy drinks<br />
Central E. Europe Ec<strong>on</strong>omic growth & changing pack mix<br />
Russia Ec<strong>on</strong>omic growth & changing pack mix<br />
Egypt Ec<strong>on</strong>omic growth<br />
Sustainable broad based growth<br />
40
Key facts<br />
Can market c. 2bn cans<br />
2001 – 2006 CAGR 8%<br />
Mainly a beer market<br />
Aluminium market with deposit<br />
system<br />
<str<strong>on</strong>g>Rexam</str<strong>on</strong>g> #1<br />
Exciting growth in Nordics<br />
Source 2006 BCME 41
Sweden<br />
Changes driving growth in Nordics<br />
• Increase in volume allowance effect (border trade)<br />
• Well functi<strong>on</strong>ing deposit return system<br />
• High c<strong>on</strong>sumer acceptance leads retailers and fillers to<br />
support cans<br />
• Denmark, Norway and Finland<br />
• Reducti<strong>on</strong> of alcohol tax drives can volume growth<br />
• Well functi<strong>on</strong>ing deposit return system<br />
• Increased c<strong>on</strong>sumer acceptance of cans<br />
42
Annual bevcan c<strong>on</strong>sumpti<strong>on</strong> per capita (units)<br />
250<br />
200<br />
150<br />
100<br />
S Korea<br />
Can c<strong>on</strong>sumpti<strong>on</strong> is catching up<br />
Spain<br />
Canada<br />
Australia<br />
Belgium<br />
UK<br />
Sweden<br />
Poland<br />
Greece<br />
Netherlands<br />
Mexico<br />
50<br />
Brazil<br />
Russia<br />
Venezuela<br />
Hungary<br />
Chile<br />
Portugal<br />
France<br />
Italy<br />
Finland<br />
Denmark<br />
Norway<br />
China Romania Czech Republic<br />
Egypt<br />
0<br />
Argentina<br />
Colombia<br />
Germany<br />
India Ukraine<br />
0 10,000 20,000 30,000 40,000 50,000 60,000 70,000<br />
Japan<br />
Source: <str<strong>on</strong>g>Rexam</str<strong>on</strong>g> estimates and Datam<strong>on</strong>itor. USA included in analysis but excluded from graph<br />
Ireland<br />
GDP per capita (current US$)<br />
43
Nordic beer market<br />
Taxati<strong>on</strong> of beer (50 cl, 5.0 %) Border Trade<br />
€1.05<br />
€0.4<br />
€0.17<br />
€0.17<br />
€0.05<br />
€0.5<br />
Total border trade:<br />
2003/4: ~600m cans (30% of the<br />
total Nordic can market)<br />
2006: 900 – 1000m cans<br />
400m<br />
700-800m<br />
700 800m<br />
50m<br />
60m 60m<br />
150m<br />
150m 150m<br />
44
• New £78m plant in Fredericia<br />
announced in October 2007<br />
• Initial demand was met via imports<br />
• <str<strong>on</strong>g>Rexam</str<strong>on</strong>g> imports exceeded 600m<br />
cans in 2006<br />
• Locati<strong>on</strong> chosen to minimise freight<br />
costs<br />
• Key l<strong>on</strong>g term customers secured<br />
• Focussed <strong>on</strong> Return <strong>on</strong> Invested<br />
Capital<br />
Denmark investment<br />
New<br />
Plant Locati<strong>on</strong><br />
Royal Unibrew<br />
125 m<br />
Carlsberg<br />
(Fredericia)<br />
320 m<br />
Carlsberg<br />
195 m<br />
Harboe<br />
170m<br />
Royal Unibrew<br />
373 m<br />
45
Key facts<br />
Can market c. 7bn cans<br />
2001 – 2006 CAGR 5%<br />
Beer and CSD market<br />
Steel market<br />
<str<strong>on</strong>g>Rexam</str<strong>on</strong>g> #1<br />
46<br />
Iberia<br />
Source 2006 BCME 46
• Demand exceeding supply by about 30%<br />
• Indicators are favourable for c<strong>on</strong>tinued can<br />
growth<br />
– High customer and c<strong>on</strong>sumer acceptance of cans<br />
– Large number of enterpreneurial fillers and brewers<br />
– <strong>Cans</strong> chill rapidly and are preferable in hot climates<br />
– Increased at home c<strong>on</strong>sumpti<strong>on</strong> of beer fuels can<br />
growth<br />
– Retailers favour multipacks promoti<strong>on</strong>s which<br />
benefit cans<br />
Why Iberia is an attractive market<br />
47
Key facts<br />
Can market c. <strong>27</strong>bn cans<br />
2001 – 2006 CAGR (0.8)%<br />
(despite Germany)<br />
2006 growth 8%<br />
Energy drinks, beer and CSD market<br />
Mixed metals<br />
<str<strong>on</strong>g>Rexam</str<strong>on</strong>g> #1<br />
Rest of Western Europe<br />
Source 2006 BCME 48<br />
48
Mn L<br />
30,000<br />
25,000<br />
20,000<br />
15,000<br />
10,000<br />
5,000<br />
0<br />
2002<br />
2003<br />
Changing c<strong>on</strong>sumer behaviour fuelling growth<br />
Beer c<strong>on</strong>sumpti<strong>on</strong><br />
<strong>on</strong>-trade vs off-trade<br />
57% 58% 59% 60% 60% 61%<br />
2004<br />
2005<br />
Off trade On trade<br />
• Increasing Can volume, despite flat c<strong>on</strong>sumpti<strong>on</strong><br />
• Can share stable at around 30% in Off-trade<br />
• Can volume driven by Off-trade growth<br />
Source: Plato Logic, Canadean & <str<strong>on</strong>g>Rexam</str<strong>on</strong>g> radar<br />
2006<br />
2007F<br />
Mn L<br />
30,000<br />
25,000<br />
20,000<br />
15,000<br />
10,000<br />
5,000<br />
0<br />
2002<br />
Soft Drink c<strong>on</strong>sumpti<strong>on</strong><br />
and pack split<br />
47% 47% 48% 49% 51% 52%<br />
17% 15% 15% 15% 15% 15%<br />
2003<br />
2004<br />
<strong>Cans</strong> Ref Glass N-Ref Glass Ref PET N-Ref PET Others<br />
2005<br />
2006<br />
• C<strong>on</strong>sumpti<strong>on</strong> flattening out<br />
• Stable can share<br />
• N<strong>on</strong> refillable PET gaining share<br />
2007F<br />
49
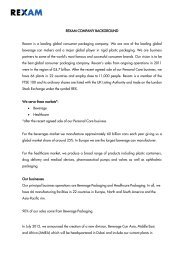
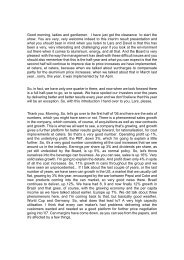
• Domestic can c<strong>on</strong>sumpti<strong>on</strong> less than<br />
10% of 2001peak but growing<br />
• Deposit system has been introduced<br />
• Large discount retailers have not relisted<br />
cans for beer or CSD<br />
• Primary beverage can use is for<br />
export market<br />
• Industry would currently be unable to<br />
meet demand if it were to return to<br />
2001 levels of c. 7bn cans<br />
German market rebased<br />
3<br />
2<br />
1<br />
0<br />
Export<br />
Domestic<br />
Export<br />
Domestic<br />
2006 2007F<br />
Source 2006 BCME 50<br />
billi<strong>on</strong>s of units<br />
German <strong>Beverage</strong> Can Fillings
Key facts<br />
Can market c. 5.4bn cans<br />
2001 – 2006 CAGR 13%<br />
Mainly a beer market<br />
Mainly aluminium<br />
<str<strong>on</strong>g>Rexam</str<strong>on</strong>g> #3<br />
Eastern Europe<br />
Source 2006 BCME 51
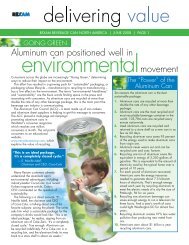
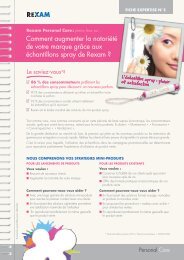
Mn L<br />
30,000<br />
25,000<br />
20,000<br />
15,000<br />
10,000<br />
5,000<br />
0<br />
15%<br />
14%<br />
54%<br />
Beer c<strong>on</strong>sumpti<strong>on</strong> &<br />
pack mix<br />
14%<br />
18%<br />
50%<br />
13%<br />
23%<br />
47%<br />
13%<br />
25%<br />
44%<br />
2002 2003 2004 2005 2006 2007F 2008F<br />
Source: Plato Logic, Canadean & <str<strong>on</strong>g>Rexam</str<strong>on</strong>g> radar<br />
12%<br />
<strong>27</strong>%<br />
41%<br />
12%<br />
28%<br />
39%<br />
12%<br />
29%<br />
38%<br />
Trends in Eastern Europe<br />
Mn L<br />
20,000<br />
15,000<br />
10,000<br />
5,000<br />
0<br />
Soft drinks c<strong>on</strong>sumpti<strong>on</strong> &<br />
pack mix<br />
15% 15% 15% 15% 17% 18% 19%<br />
3% 3% 4% 5% 5% 5% 5%<br />
86%<br />
86%<br />
87%<br />
87%<br />
2002 2003 2004 2005 2006 2007F 2008F<br />
<strong>Cans</strong> Ref Glass N-Ref Glass Ref PET N-ref PET Others<br />
87%<br />
87%<br />
88%<br />
52
Strategic opportunities in Eastern Europe<br />
• C<strong>on</strong>tinued growth dynamics<br />
– Beer c<strong>on</strong>sumpti<strong>on</strong> increasing as c<strong>on</strong>sumers move away from spirits<br />
– Off-premise sales c<strong>on</strong>sidered to be main driver<br />
– Returnable glass c<strong>on</strong>tinues to lose share<br />
• <str<strong>on</strong>g>Rexam</str<strong>on</strong>g> geographically under represented in regi<strong>on</strong><br />
• Key account customers expect strategic suppliers to be<br />
located close to their plants<br />
Use exports to increase presence and build scale before investing<br />
53
Key facts<br />
Can market c. 4bn cans<br />
2001 – 2006 CAGR 25%<br />
Beer market<br />
Aluminium market<br />
<str<strong>on</strong>g>Rexam</str<strong>on</strong>g> #2 (ex Rostar)<br />
Russia<br />
Source 2006 BCME 54
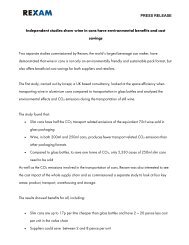
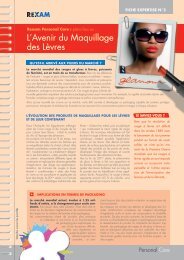
Billi<strong>on</strong>s of units<br />
30<br />
25<br />
20<br />
15<br />
10<br />
5<br />
0<br />
2001<br />
2002<br />
2003<br />
Russia<br />
<strong>Beverage</strong> Packaging Market<br />
Market and mix shift driving can growth<br />
2004<br />
2005<br />
2006<br />
100%<br />
80%<br />
60%<br />
40%<br />
20%<br />
<strong>Cans</strong> Refilable Glass N<strong>on</strong>-refilable Glass PET Cart<strong>on</strong>s Other<br />
0%<br />
2001<br />
2002<br />
2003<br />
Russia<br />
<strong>Beverage</strong> Packaging Mix<br />
2004<br />
2005<br />
2006<br />
55
Investment in Russia key to capture growth<br />
• Chelyabinsk plant<br />
– Capture growth geographically<br />
– Customers also investing in brewing<br />
capacity in Siberia<br />
• New line in Moscow<br />
– C<strong>on</strong>tinue to promote innovati<strong>on</strong><br />
– Capture growth in 1L speciality cans<br />
– Introduced Slim into Russia<br />
• Proposed Rostar acquisiti<strong>on</strong><br />
– Establish leadership in regi<strong>on</strong><br />
56
• Growing c<strong>on</strong>sumpti<strong>on</strong> and changing<br />
pack mix driving growth<br />
• Increased can demand in Egypt and<br />
throughout the regi<strong>on</strong><br />
• Mainly a CSD market<br />
• <strong>Cans</strong> chill rapidly and are<br />
preferable in hot climates<br />
• <str<strong>on</strong>g>Rexam</str<strong>on</strong>g> doubling capacity to meet<br />
demand<br />
• Foothold to develop markets in<br />
Northern Africa and the Middle East<br />
Egypt<br />
57
• Str<strong>on</strong>g focus <strong>on</strong> cost<br />
performance and<br />
executi<strong>on</strong><br />
• Sharing best practice<br />
globally<br />
• Weight reducti<strong>on</strong><br />
• Reduce spoilage<br />
• Energy savings<br />
Operati<strong>on</strong>al excellence in Europe<br />
58
Summary<br />
• New c<strong>on</strong>tract structure minimises exposure to metal<br />
cost volatility and secures cash margins<br />
• Growth in specialty cans will improve mix<br />
• Operati<strong>on</strong>al excellence will c<strong>on</strong>tinue to deliver<br />
efficiencies<br />
Europe is an exciting market with profitable growth opportunities<br />
59
Leslie Van de Walle<br />
Chief Executive Officer
C<strong>on</strong>clusi<strong>on</strong><br />
Investing to deliver profitable growth<br />
61
Q & A
Forward Looking Statements<br />
This presentati<strong>on</strong> c<strong>on</strong>tains forward looking statements, which are based <strong>on</strong> the Board's current expectati<strong>on</strong>s and<br />
assumpti<strong>on</strong>s and involve known and unknown risks and uncertainties that could cause actual results,<br />
performance or events to differ materially from those expressed or implied in such statements. The forward<br />
looking statements c<strong>on</strong>tained in this presentati<strong>on</strong> are based <strong>on</strong> past trends or activities and should not be taken<br />
as a representati<strong>on</strong> that such trends or activities will c<strong>on</strong>tinue in the future. It is believed that the expectati<strong>on</strong>s<br />
reflected in these statements are reas<strong>on</strong>able, but they may be affected by a number of variables which could<br />
cause actual results or trends to differ materially, including, but not limited to: c<strong>on</strong>diti<strong>on</strong>s in the market, market<br />
positi<strong>on</strong> of the companies comprising the <str<strong>on</strong>g>Rexam</str<strong>on</strong>g> Group, earnings, financial positi<strong>on</strong>, cash flows, return <strong>on</strong><br />
capital and operating margins, anticipated investments and ec<strong>on</strong>omic c<strong>on</strong>diti<strong>on</strong>s; the Group's ability to obtain<br />
capital/additi<strong>on</strong>al finance; a reducti<strong>on</strong> in demand by customers; an increase in competiti<strong>on</strong>; an unexpected<br />
decline in revenue or profitability; legislative, fiscal and regulatory developments, including, but not limited to,<br />
changes in envir<strong>on</strong>mental and health and safety regulati<strong>on</strong>s; exchange rate fluctuati<strong>on</strong>s; retenti<strong>on</strong> of senior<br />
management; the maintenance of labour relati<strong>on</strong>s; fluctuati<strong>on</strong>s in the cost of raw material and other input costs;<br />
accounting for defined benefit or other pensi<strong>on</strong> schemes; and operating and financial restricti<strong>on</strong>s as a result of<br />
financing arrangements.<br />
No statement in this presentati<strong>on</strong> is intended to c<strong>on</strong>stitute a profit forecast, nor should any statements be<br />
interpreted to mean that earnings or earnings per Ordinary Share will necessarily be greater or lesser than those<br />
for the relevant preceding financial periods for the Company. Rather, these statements should be c<strong>on</strong>strued as<br />
references to potential enhancements to the earnings that might otherwise have been earned during the relevant<br />
financial period. Each forward-looking statement relates <strong>on</strong>ly as of the date of the particular statement. Except as<br />
required by the Listing Rules, the Disclosure and Transparency Rules, the Prospectus Rules, the L<strong>on</strong>d<strong>on</strong> Stock<br />
Exchange or otherwise by law, the Company expressly disclaims any obligati<strong>on</strong> or undertaking to release<br />
publicly any updates or revisi<strong>on</strong>s to any forward looking statements c<strong>on</strong>tained herein to reflect any change in the<br />
Company's expectati<strong>on</strong>s with regard thereto or any change in events, c<strong>on</strong>diti<strong>on</strong>s or circumstances <strong>on</strong> which any<br />
such statement is based.