Swing Futures Due Diligence Report-Public.pdf

You also want an ePaper? Increase the reach of your titles
YUMPU automatically turns print PDFs into web optimized ePapers that Google loves.
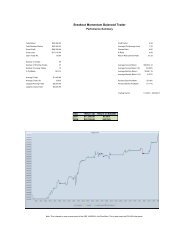
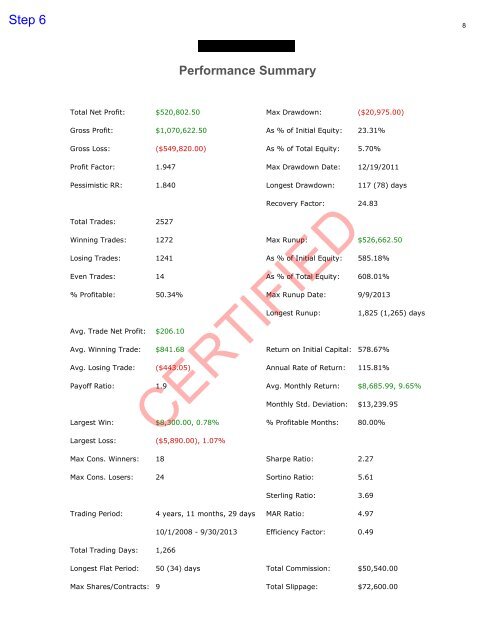
Step 68Performance SummaryTotal Net Profit: $520,802.50 Max Drawdown: ($20,975.00)Gross Profit: $1,070,622.50 As % of Initial Equity: 23.31%Gross Loss: ($549,820.00) As % of Total Equity: 5.70%Profit Factor: 1.947 Max Drawdown Date: 12/19/2011Pessimistic RR: 1.840 Longest Drawdown: 117 (78) daysTotal Trades: 2527Recovery Factor: 24.83Winning Trades: 1272 Max Runup: $526,662.50Losing Trades: 1241 As % of Initial Equity: 585.18%Even Trades: 14 As % of Total Equity: 608.01%% Profitable: 50.34% Max Runup Date: 9/9/2013Longest Runup:1,825 (1,265) daysAvg. Trade Net Profit: $206.10Avg. Winning Trade: $841.68 Return on Initial Capital: 578.67%Avg. Losing Trade: ($443.05) Annual Rate of Return: 115.81%Payoff Ratio: 1.9 Avg. Monthly Return: $8,685.99, 9.65%Monthly Std. Deviation: $13,239.95Largest Win: $8,300.00, 0.78% % Profitable Months: 80.00%Largest Loss: ($5,890.00), 1.07%CERTIFIEDMax Cons. Winners: 18 Sharpe Ratio: 2.27Max Cons. Losers: 24 Sortino Ratio: 5.61Sterling Ratio: 3.69Trading Period: 4 years, 11 months, 29 days MAR Ratio: 4.9710/1/2008 - 9/30/2013 Efficiency Factor: 0.49Total Trading Days: 1,266Longest Flat Period: 50 (34) days Total Commission: $50,540.00Max Shares/Contracts: 9 Total Slippage: $72,600.00