
Create successful ePaper yourself
Turn your PDF publications into a flip-book with our unique Google optimized e-Paper software.
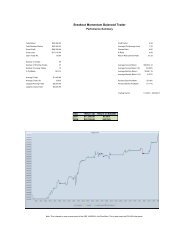
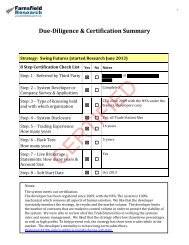
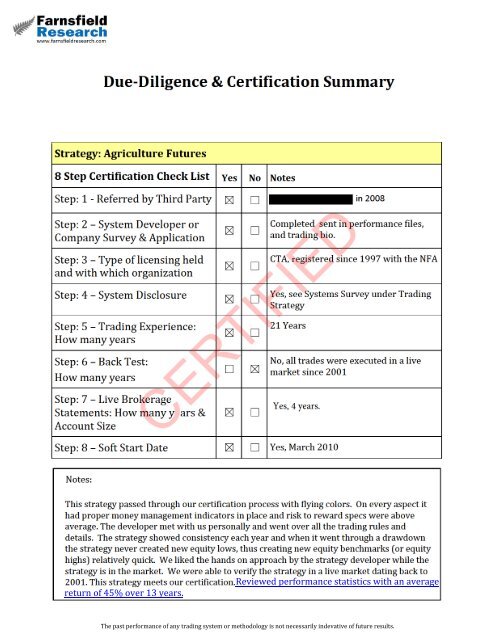
return of 45% over 13 years.<br />
Reviewed performance statistics with an average<br />
The past performance of any trading system or methodology is not necessarily indevative of future results.
Step 2<br />
FarnsField Research, Inc.<br />
2<br />
SYSTEM DEVELOPER AND STRATEGY SURVEY<br />
SUMMARY OF SURVEY<br />
The purpose of this questionnaire survey is to help Farnsfield develop an understanding of the background<br />
experience of the trading team and strategy system developer. It also provides us with the facts and information<br />
needed to begin our due diligence process and determine whether or not the strategy and system is a good fit for<br />
our own trading. The more detailed information provided, the more efficient our process will be.<br />
DOCUMENTATION NEEDED<br />
Please provide the following documents if available. If not available please explain why. Please type in your<br />
answers in a blue font color as well as in italic, and email the survey back to us (DO NOT FAX).<br />
<br />
Is anyone on the team registered as a CTA or fund manager, please provide details on what entity name<br />
this is listed under<br />
Photo – formal head shot. Send 2-3 so we can choose. The photo we select will be used for your bio<br />
page on the website. Format – high resolution .tif or .jpg<br />
<br />
<br />
<br />
<br />
<br />
<br />
<br />
<br />
<br />
<br />
Track/performance Record – at least 3 years of actual real time trades in the market<br />
Back test of trading performance of no less than 3-years<br />
Sample trading charts – high resolution<br />
Broker statements (Personal, trading fund of client’s)<br />
Professional references with contact information<br />
Testimonials from subscribers/clients<br />
Articles, interviews, You Tube videos, audio files, or trading reports<br />
Power Point Presentation<br />
Website (if you have a website please provide)<br />
Self-Bio (Provide information on how the developer and/or team came into trading and what previous<br />
experience was outside of trading<br />
CONTACT INFORMATION OF DEVELOPER AND/OR TEAM<br />
Full Name of Developer: Editor & Publisher, PTA Publications, Inc.<br />
Additional Team Members: Brian Schad, Developer<br />
Company Name: PTA Publications, Inc.<br />
Physical address: (Undisclosed)<br />
Billing address: (Undisclosed)<br />
Telephone (cell and office): (Undisclosed)<br />
Email: (Undisclosed)<br />
CERTIFIED<br />
Skype / Yahoo Messenger / MSN Messenger (if applicable): N/A<br />
CONFIDENTIAL Page 1 of 4
Step 2 3<br />
FarnsField Research, Inc.<br />
TRADING BACKGROUND<br />
How many years of trading experience do the developer or strategy team have?<br />
21 years<br />
How did the developer or team get involved in trading? My Navy platoon buddy advised me to meet his<br />
brother after we returned from deployment. He traded stock options from a variety of 50 of the best<br />
volume traded companies available at that time. At the end of the next year, I learned to trade commodity<br />
futures and had the privilege to meet – who is still my teacher, mentor, and friend to this day – Larry<br />
Williams. Larry’s guidance early on catapulted my trading and learning curve, but most of all<br />
CONFIDENCE.<br />
What are the biggest strengths does the developer or strategy team have? My biggest strengths as a trader is<br />
being able to research my strategies to find trading parameters to accommodate what I learned early on in<br />
this business, and that is to take ALL TRADES with the trend. I have no problem “pulling the trigger”<br />
with my exclusive signals because every trade has history and statistics behind it.<br />
What are the biggest weaknesses? I have recently overcome my biggest w eakness I had as a trader which<br />
was “skipping” trades based on the recent volatility of the market – far. Most of he time there were no<br />
trades following high-volatility days, but when there were, I missed some good trades thinking I was<br />
“doing the right thing” by protecting equity. I’ll divulge how I accomplished this in comments below…<br />
What was a trading experience where the developer learned valuable lesson about the markets and yourself?<br />
19 years ago I took my biggest trading loss when I veered away from my trading plan. It should have been<br />
my biggest trading “win” to that date, but there were two of us trading one account. BIG MISTAKE.<br />
So I forced myself to do more research on my trading strategy and documented it on paper for reference<br />
(documenting your work in a journal is powerful some of you already know). When you write your rules<br />
down you tend to stick to them with better conviction I have reinforced my trading strategies based upon<br />
this lesson.<br />
What are the developers and teams trading expertise (Stocks, Futures, Forex, Options, ETF’s, etc.) I have<br />
been strictly trading commodity futures (and options) for 21 years now.<br />
How would the developer describe the trading style of your strategy (intraday, swing trading, long-term, trend)?<br />
The core of my trading style is trend-following, but I do not commit to any position for any longer than I<br />
have to, so I look to take advantage of the swings of the market as well – swing-trading. Finally, my trading<br />
style is more mechanically inclined with strict rules and parameters than discretionary in nature.<br />
TRADING STRATEGY<br />
CERTIFIED<br />
Is the system based on technical or fundamentals? My trend following trading strategy utilizes specific entry<br />
& exit signals based on price structure, market volatility, and trading psychology. Once a trade is placed<br />
and I am in the market, a protective “stop-loss” is automatically utilized. My trading strategy’s goal is to<br />
buy the dips and sell the rallies and to remain in the market as long as the market (and my position) is<br />
trading in the direction of the overall trend.<br />
What are the benefits of the trading strategy? Why would an investor choose the strategy/style over another?<br />
The benefits of this trading strategy, and why an investor/trader would choose my style is because if a<br />
market is trending, then chances are I will be in that market with a position. The only way to make money<br />
in the marketplace is to be in the market. Even when the market is experiencing high volatility, I have<br />
restructured my trading strategies to have a maximum dollar stop-loss, as well as target prices for EACH<br />
CONFIDENTIAL Page 2 of 4
Step 2<br />
4<br />
FarnsField Research, Inc.<br />
TRADE – allowing me to take the maximum number of trades and to be “in the market” with fear, or<br />
hesitation. I am trading according to the winning statistics I researched long ago.<br />
How many trades are made on average each per month? For the $25K portfolio of markets: 18-23 For the<br />
$50K portfolio of markets: 33-38<br />
What are the average non-compounded returns per year? For the $25K portfolio: 47% and for the $50K<br />
portfolio: 45% (based on actual fills reported by accommodating brokers and $10 “all in” round-turn<br />
commission rate).<br />
What is the average drawdown? For 13 years record (for ALL statistics below), the $25K portfolio: 10-12%<br />
For the $50K portfolio: 10-12%<br />
What was the biggest drawdown? For the $25K portfolio: $15,603 from December 2010 – September<br />
2011. For the $50K portfolio: $29,527 from December 2010 – August 2011.<br />
What is the stop loss for each trade? It varies with each market and with each individual trade on a daily<br />
basis, but each market has a maximum dollar stop loss to prevent unforeseable “runaway” trades.<br />
What is the ratio of winners to losers?<br />
For the $25K portfolio: 47% accuracy with a 1.5 profit loss ratio<br />
$50K portfolio.<br />
which is exactly the same with the<br />
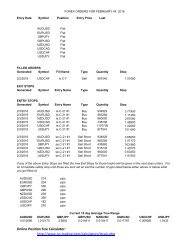
When does the strategy take profits on each trade? There are three ways, two of which can be objective: 1)<br />
when the mechanics of the trading strategy stop us out; ) when an “Ultimate Profit Objective” is reached.<br />
The third method requires on sight market supervision to visually “see” when a market is unable to hold<br />
its gains (when long), or a weak market making an unexpected come-back higher (when short) which only<br />
happens few and far between. These are the three ways.<br />
Does a trader/investor need to watch the market all day in order to trade the strategy? No, not at all. But if<br />
the trader/investor would like to be notified of any intra-day change in the trading plan, I am happy to<br />
add to my e-mail distribution list notifying of a change to the plan.<br />
TRADING ACCOUNT<br />
CERTIFIED<br />
What minimum trading account size does the developer recommend to effectively trade the system? There are<br />
two main trading strategies: the $25K & $50K suggested trading portfolios. This is the minimum<br />
suggested trading amount for both, and there are also variations of these two portfolios that denote the<br />
minimum amounts with the exception of the $10K & $15K portfolios – I would suggest $2,500 more<br />
minimum for these two.<br />
What are the developer’s thoughts on money management? Money management is the key to a successful<br />
trading experience with longevity. Money management must come first before all else. This is why each<br />
trade has specific parameters such as mandatory protective stops, a maximum dollar stop loss, as well as<br />
an ultimate target objective to anticipate when the markets become unexpectedly volatile.<br />
What is the maximum percent that the developer recommends exposing to risk on any single trade? As far as<br />
the maximum percent exposing on any single trade… this strategy is one of the few that is MORE<br />
conservative than using a straight percent as my peers. The mechanics of the actual trading strategy<br />
CONFIDENTIAL Page 3 of 4
Step 2 5<br />
FarnsField Research, Inc.<br />
require the market (price structure, volatility, and history) to determine where the risk is going to be at<br />
any given moment of the open trade.<br />
Is the developer willing to offer a guarantee? Yes, if the customer is not completely satisfied at the end of the<br />
subscription service-term – for any reason – I will invite the customer to continue trading with me in<br />
three-month increments until the subscription fee and a minimum 12% profit has been realized<br />
(excluding commissions). This is why the customer must negotiate with the variety of recommended<br />
brokers as low a commission rate as possible. I pay $10 per “all in” round-turn fee. For traders<br />
positioned with $25K accounts sizes or less, expect as low as $12-15 “all in” rates with some of<br />
recommended brokers.<br />
COMPETITION<br />
Which traders/websites are the developer’s main competitors? I only compete with my inner-psyche. I have<br />
learned others see me as their competition when I was a World Cup Advisor top-trader. <br />
SUPPORTING DOCUMENTS (Farnsfield may want to utilize or republish for marketing purposes)<br />
Has the developer or team written any articles or reports that we may review? I have a World Cup Advisor<br />
website snapshot of my standing with them and their traders dated September 9 th 2009 you are welcome<br />
to use provided you block out my name and image (World Cup won like it, but they do not respect<br />
copyright laws anyway). You will see<br />
stock option program that was added a couple of<br />
months before this date. Investors needed a $150K minimum sized account in order to realize those<br />
profits - $35K with mine.<br />
Is there anything else that the developer would like to add? Before working with Farnsfield, I was a trader<br />
with a new program at World Cup Advisor. After the end of the first year, my $50K (they were allowing<br />
customers with $35K) portfolio climbed to the top and surpassed ALL OTHER TRADERS AND THEIR<br />
PROGRAMS DOLLAR FOR DOLLAR. My unique strategy stayed at the #1 position for the next 3.5 years<br />
and my only reason for leaving them was promotion of other traders programs when mine was in a<br />
drawdown phase. Even during these periods, no other trader surpassed my strategy’s cumulative profits.<br />
THANK YOU!<br />
Farnsfield appreciates that you took the time in completing this survey. Your input is critical to the success of<br />
our mutual partnership! We will review your survey and be back in touch in setting up another conversation<br />
within the next few weeks.<br />
CERTIFIED<br />
CONFIDENTIAL Page 4 of 4
BASIC Details<br />
https://www.nfa.futures.org/basicnet/Details.aspx?entityid=UUe8ySPbas...<br />
1 of 2 2/26/2014 3:08 PM<br />
Step 3<br />
News Center Swaps Information Information for DCMs and SEFs NFA Manual File a Complaint Careers at NFA<br />
Details<br />
BRIAN RICHARD SCHAD NFA ID: 0269882<br />
Current Status<br />
• ALSO SEE NFA ID 0276711<br />
SCHAD COMMODITY FUTURES & OPTIONS TRADING CORPORATION<br />
• NFA ASSOCIATE MEMBER PENDING<br />
• ASSOCIATED PERSON REGISTERED<br />
• PRINCIPAL APPROVED<br />
Regulatory Actions<br />
Agency<br />
Number<br />
NFA 0<br />
CFTC 0<br />
Exchanges 0<br />
details...<br />
NFA Arbitration Decisions<br />
Role<br />
Number<br />
Claimant 0<br />
Respondent 0<br />
details...<br />
CFTC Reparations Cases<br />
Total 0<br />
details...<br />
Formerly Known As<br />
No other names<br />
Security Futures Proficiency Training<br />
No proficiency information available<br />
Doing Business As<br />
No other names<br />
History<br />
Status<br />
• ALSO SEE NFA ID 0276711<br />
Effective Date<br />
ATLAS FUTURES INC<br />
• ASSOCIATED PERSON WITHDRAWN 01/09/1997<br />
• NFA ASSOCIATE MEMBER WITHDRAWN 01/09/1997<br />
• ASSOCIATED PERSON REGISTERED 05/06/1996<br />
• NFA ASSOCIATE MEMBER APPROVED 05/06/1996<br />
• ASSOCIATED PERSON PENDING 02/27/1996<br />
• NFA ASSOCIATE MEMBER PENDING 02/27/1996<br />
OPPORTUNITIES IN OPTIONS<br />
• ASSOCIATED PERSON WITHDRAWN 01/09/1997<br />
• NFA ASSOCIATE MEMBER WITHDRAWN 01/09/1997<br />
• ASSOCIATED PERSON REGISTERED 05/06/1996<br />
• NFA ASSOCIATE MEMBER APPROVED 05/06/1996<br />
• PRINCIPAL PENDING STATUS WITHDRAWN 03/21/1996<br />
• ASSOCIATED PERSON PENDING 03/13/1996<br />
• NFA ASSOCIATE MEMBER PENDING 03/13/1996<br />
• PRINCIPAL PENDING 02/27/1996<br />
SCHAD BRIAN RICHARD<br />
• PRINCIPAL WITHDRAWN 04/04/2003<br />
• PRINCIPAL APPROVED 01/30/1997<br />
• PRINCIPAL PENDING 01/21/1997<br />
SCHAD COMMODITY FUT & OPTS TRDG CORP<br />
• ASSOCIATED PERSON WITHDRAWN 12/22/2000<br />
• NFA ASSOCIATE MEMBER WITHDRAWN 12/22/2000<br />
• PRINCIPAL WITHDRAWN 12/22/2000
1 of 1 2/26/2014 3:07 PM<br />
BASIC Details<br />
Step 3<br />
https://www.nfa.futures.org/BasicNet/Details.aspx?entityid=uJ3hUu9eF7s=<br />
News Center Swaps Information Information for DCMs and SEFs NFA Manual File a Complaint Careers at NFA<br />
Details<br />
SCHAD COMMODITY FUTURES & OPTIONS TRADING CORPORATION NFA ID: 0382675<br />
Current Status<br />
• NFA MEMBER PENDING<br />
• COMMODITY TRADING ADVISOR REGISTERED<br />
Exemptions<br />
Click the link below to view exemptions for this firm<br />
View Exemptions<br />
Regulatory Actions<br />
Agency<br />
Number<br />
NFA 0<br />
CFTC 0<br />
Exchanges 0<br />
details...<br />
NFA Arbitration Decisions<br />
Role<br />
Number<br />
Claimant 0<br />
Respondent 0<br />
details...<br />
CFTC Reparations Cases<br />
Total 0<br />
details...<br />
Formerly Known As<br />
No other names<br />
Business Address<br />
Doing Business As<br />
No other names<br />
Listed Principals<br />
Listed Principal Name<br />
Title<br />
10% or More<br />
Financial Interest<br />
BRIAN RICHARD SCHAD PRESIDENT YES<br />
History<br />
Status<br />
Effective Date<br />
• INTRODUCING BROKER PENDING STATUS WITHDRAWN 01/19/2014<br />
• INTRODUCING BROKER PENDING 04/26/2013<br />
• NFA MEMBER PENDING 04/26/2013<br />
• NFA MEMBER WITHDRAWN 02/01/2013<br />
• NFA MEMBER APPROVED 12/21/2010<br />
• NFA MEMBER PENDING 12/03/2010<br />
• NFA MEMBER WITHDRAWN 10/05/2008<br />
• NFA MEMBER APPROVED 10/16/2007<br />
• COMMODITY TRADING ADVISOR REGISTERED 10/16/2007<br />
• NFA MEMBER PENDING 05/16/2007<br />
• COMMODITY TRADING ADVISOR PENDING 05/09/2007<br />
NFA is the premier independent provider of efficient and innovative regulatory programs that safeguard the integrity of the futures markets.<br />
Site Index | Contact NFA | News Center | FAQs | Career Opportunities | Industry Links | Home<br />
© 2014 National Futures Association All Rights Reserved. | Disclaimer and Privacy Policy
Step 6<br />
8<br />
$15K= KW, SB, CT, SM # Trades Client Profit/Loss %+ Av + Av- Profit Factor % Gain or Loss Avrg Yearly ROR + - Ttl + or - (no comm) Ttl + Ttl + less Comm Ttl - Ttl - less Comm<br />
$ 15,000.00<br />
1207 $ 99,740.98 49% $ 536.95 $ (345.23) 1.56 665% 67% 594 600 $ 111,810.98 $ 318,950.28 $ 313,010.28 $ (207,139.30) $ (213,139.30)<br />
$20K= KW, SB, CT, SM, C # Trades Client Profit/Loss %+ Av + Av- Profit Factor % Gain or Loss Avrg Yearly ROR + - Ttl + or - (no comm) Ttl + Ttl + less Comm Ttl - Ttl - less Comm<br />
$ 20,000.00<br />
1517 $ 128,484.73 50% $ 514.59 $ (329.31) 1.56 642% 65% 754 742 $ 143,654.73 $ 388,000.28 $ 380,460.28 $ (244,345.55) $ (251,765.55)<br />
$25K= KW, SB, CT, SM, C, W, YG # Trades Client Profit/Loss %+ Av + Av- Profit Factor % Gain or Loss Avrg Yearly ROR + - Ttl + or - (no comm) Ttl + Ttl + less Comm Ttl - Ttl - less Comm<br />
$ 25,000.00<br />
2110 $ 133,113.25 45% $ 513.33 $ (337.46) 1.52 532% 54% 945 985 $ 152,693.25 $ 485,094.01 $ 475,644.01 $ (332,400.76) $ (342,250.76)<br />
Years Contract # Trades Client Profit/Loss %+ Av + Av- Profit Factor % Gain or Loss Avrg Yearly ROR + - Ttl + or - (no comm) Ttl + Ttl + less Comm Ttl - Ttl - less Comm<br />
Commission Rate $ 10.00<br />
2005 + W 194 $ (8,922.50) 43% $ 490 $ (463) 1.058 83 107 $ (6,982.50) $ 41,505.00 $ 40,675.00 $ (48,487.50) $ (49,557.50)<br />
2001-2004 W 125 $ 5,475.00 40% $ 513 $ (276) 1.859 50 73 $ 6,725.00 $ 26,125.00 $ 25,625.00 $ (19,400.00) $ (20,130.00)<br />
Totals 319 $ (3,447.50) 42% $ 498 $ (387) 1.288 133 1 $ (257.50) $ 67,630.00 $ 66,300.00 $ (67,887.50) $ (69,687.50)<br />
2005 + C 195 $ 23,381.25 54% $ 504 $ (347) 1.452 05 85 $ 25,331.25 $ 54,012.50 $ 52,962.50 $ (28,681.25) $ (29,531.25)<br />
2001-2004 C 115 $ 5,362.50 48% $ 263 $ (160) 1.651 5 57 $ 6,512.50 $ 15,037.50 $ 14,487.50 $ (8,525.00) $ (9,095.00)<br />
Totals 310 $ 28,743.75 52% $ 422 $ (272) 1.550 160 142 $ 31,843.75 $ 69,050.00 $ 67,450.00 $ (37,206.25) $ (38,626.25)<br />
2005 + KC 83 $ (2,855.00) 42% $ 1,181 $ (940) 1.256 35 47 $ (2,025.00) $ 41,681.25 $ 41,331.25 $ (43,706.25) $ (44,176.25)<br />
2001-2004 KC 146 $ 19,348.50 53% $ 740 $ (561) 1.319 77 67 $ 20,808.50 $ 57,714.75 $ 56,944.75 $ (36,906.25) $ (37,576.25)<br />
Totals 229 $ 16,493.50 49% $ 877 $ (717) 1.224 112 114 $ 18,783.50 $ 99,396.00 $ 98,276.00 $ (80,612.50) $ (81,752.50)<br />
2005 + LC 212 $ 332.00 47% $ 409 $ (372) 1.100 100 109 $ 2,452.00 $ 41,904.00 $ 40,904.00 $ (39,452.00) $ (40,542.00)<br />
2001-2004 LC 133 $ 16,297.00 48% $ 587 $ (313) 1.8 64 68 $ 17,627.00 $ 38,200.00 $ 37,560.00 $ (20,573.00) $ (21,253.00)<br />
Totals 345 $ 16,629.00 48% $ 478 $ (349) 1.370 164 177 $ 20,079.00 $ 80,104.00 $ 78,464.00 $ (60,025.00) $ (61,795.00)<br />
2005 + CC 114 $ (8,340.00) 39% $ 373 $ (370) 1.010 45 68 $ (7,200.00) $ 17,250.00 $ 16,800.00 $ (24,450.00) $ (25,130.00)<br />
2001-2004 CC 131 $ (1,123.00) 46% $ 441 $ (389) 135 60 71 $ 187.00 $ 27,087.00 $ 26,487.00 $ (26,900.00) $ (27,610.00)<br />
Totals 245 $ (9,463.00) 43% $ 412 $ ( 9) 1.0 105 139 $ (7,013.00) $ 44,337.00 $ 43,287.00 $ (51,350.00) $ (52,740.00)<br />
2005 + BO 161 $ 2,320.00 48% $ 376 $ (31 ) 1.186 77 84 $ 3,930.00 $ 29,754.00 $ 28,984.00 $ (25,824.00) $ (26,664.00)<br />
2001-2004 BO 119 $ 1,346.00 45% $ 278 ( 3) 1.303 54 64 $ 2,536.00 $ 15,552.00 $ 15,012.00 $ (13,016.00) $ (13,656.00)<br />
Totals 280 $ 3,666.00 47% $ 336 $ (272) 1.233 131 148 $ 6,466.00 $ 45,306.00 $ 43,996.00 $ (38,840.00) $ (40,320.00)<br />
2005 + GC 41 $ 5,903.33 56% $ 568 $ (3 ) 1.427 23 18 $ 6,313.33 $ 13,303.33 $ 13,073.33 $ (6,990.00) $ (7,170.00)<br />
2001-2004 GC 111 $ 9,890.00 53% 2 $ (318) 1.360 59 49 $ 11,000.00 $ 26,070.00 $ 25,480.00 $ (15,070.00) $ (15,560.00)<br />
2005 + YG 122 $ 8,076.02 48% $ 498 $ (330) 1.509 58 63 $ 9,296.02 $ 29,463.73 $ 28,883.73 $ (20,167.71) $ (20,797.71)<br />
Totals Total Gold 274 $ 23,869.3 51% $ 82 (335) 1.439 140 130 $ 26,609.35 $ 68,837.06 $ 67,437.06 $ (42,227.71) $ (43,527.71)<br />
CERTIFIED<br />
2005 + SI 46 $ 6,07 00 52% $ 883 $ (719) 1.228 24 21 $ 6,539.00 $ 21,429.00 $ 21,189.00 $ (14,890.00) $ (15,100.00)<br />
2001-2004 SI 111 $ 5,965 0 42% $ 580 $ (343) 1.690 47 62 $ 7,075.00 $ 27,750.00 $ 27,280.00 $ (20,675.00) $ (21,295.00)<br />
2005 + YI 2 $ 1,668.0 50% $ 1,705 $ (37) 46.081 1 1 $ 1,688.00 $ 1,715.00 $ 1,705.00 $ (27.00) $ (37.00)<br />
Totals Total Silver 159 $ 13,712.00 4 $ 697 $ (434) 1.607 72 84 $ 15,302.00 $ 50,894.00 $ 50,174.00 $ (35,592.00) $ (36,432.00)<br />
2005 + CT 154 $ 11,386.06 50% $ 634 $ (486) 1.304 77 77 $ 12,926.06 $ 49,576.56 $ 48,806.56 $ (36,650.50) $ (37,420.50)<br />
2001-2004 CT 122 $ 26,320.00 51% $ 873 $ (487) 1.792 62 57 $ 27,540.00 $ 54,740.00 $ 54,120.00 $ (27,200.00) $ (27,770.00)<br />
Totals 276 $ 37,706.06 50% $ 740 $ (486) 1.522 139 134 $ 40,466.06 $ 104,316.56 $ 102,926.56 $ (63,850.50) $ (65,190.50)<br />
2005 + KW 189 $ 7,160.00 49% $ 517 $ (430) 1.204 92 94 $ 9,050.00 $ 48,500.00 $ 47,580.00 $ (39,450.00) $ (40,390.00)<br />
2001-2004 KW 147 $ 12,230.00 46% $ 449 $ (226) 1.987 67 79 $ 13,700.00 $ 30,775.00 $ 30,105.00 $ (17,075.00) $ (17,865.00)<br />
Totals 336 $ 19,390.00 47% $ 489 $ (337) 1.451 159 173 $ 22,750.00 $ 79,275.00 $ 77,685.00 $ (56,525.00) $ (58,255.00)<br />
2005 + LH 219 $ 8,950.00 48% $ 494 $ (388) 1.275 106 112 $ 11,140.00 $ 53,468.00 $ 52,408.00 $ (42,328.00) $ (43,448.00)<br />
2001-2004 LH 162 $ 8,584.00 48% $ 504 $ (373) 1.352 77 81 $ 10,204.00 $ 39,612.00 $ 38,842.00 $ (29,408.00) $ (30,218.00)<br />
Totals 381 $ 17,534.00 48% $ 499 $ (382) 1.306 183 193 $ 21,344.00 $ 93,080.00 $ 91,250.00 $ (71,736.00) $ (73,666.00)
Step 6 9<br />
2005 + S 170 $ 25,887.50 52% $ 832 $ (584) 1.424 88 81 $ 27,587.50 $ 74,112.50 $ 73,232.50 $ (46,525.00) $ (47,335.00)<br />
2001-2004 S 134 $ 4,180.00 50% $ 607 $ (553) 1.098 67 66 $ 5,520.00 $ 41,362.50 $ 40,692.50 $ (35,842.50) $ (36,502.50)<br />
2005 + YS 145 $ (2,227.00) 43% $ 385 $ (318) 1.210 62 82 $ (777.00) $ 24,499.00 $ 23,879.00 $ (25,276.00) $ (26,096.00)<br />
Totals 449 $ 27,840.50 48% $ 635 $ (480) 1.323 217 229 $ 32,330.50 $ 139,974.00 $ 137,804.00 $ (107,643.50) $ (109,933.50)<br />
2005 + HG 67 $ 35,042.50 51% $ 1,746 $ (737) 2.369 34 33 $ 35,712.50 $ 59,712.50 $ 59,372.50 $ (24,000.00) $ (24,330.00)<br />
2001-2004 HG 123 $ 9,677.50 58% $ 363 $ (328) 1.106 71 49 $ 10,907.50 $ 26,512.50 $ 25,802.50 $ (15,605.00) $ (16,095.00)<br />
Totals 190 $ 44,720.00 55% $ 811 $ (493) 1.645 105 82 $ 46,620.00 $ 86,225.00 $ 85,175.00 $ (39,605.00) $ (40,425.00)<br />
2005 + SM 157 $ 7,972.00 54% $ 423 $ (405) 1.044 85 69 $ 9,542.00 $ 36,825.00 $ 35,975.00 $ (27,283.00) $ (27,973.00)<br />
2001-2004 SM 126 $ 11,270.00 49% $ 490 $ (304) 1.615 62 3 $ 12,530.00 $ 31,030.00 $ 30,410.00 $ (18,500.00) $ (19,130.00)<br />
Totals 283 $ 19,242.00 52% $ 452 $ (357) 1.266 147 1 2 $ 22,072.00 $ 67,855.00 $ 66,385.00 $ (45,783.00) $ (47,103.00)<br />
2005 + QM 21 $ (5,897.50) 43% $ 934 $ (1,192) 0.784 9 12 $ (5,687.50) $ 8,500.00 $ 8,410.00 $ (14,187.50) $ (14,307.50)<br />
2001-2004 QM 0 $ -<br />
0 $ - $ - $ - $ - $ -<br />
Totals 21 $ (5,897.50) 43% $ 934 $ (1,192) 0.784 9 12 $ (5,687.50) $ 8,500.00 $ 8,410.00 $ (14,187.50) $ (14,307.50)<br />
2005 + SB 196 $ 21,324.80 51% $ 546 $ (351) 1.559 100 95 $ 23,284.80 $ 55,641.60 $ 54,641.60 $ (32,356.80) $ (33,306.80)<br />
2001-2004 SB 116 $ 2,078.12 42% $ 232 $ (141) 1.650 49 66 $ 3,238.12 $ 11,862.12 $ 11,372.12 $ (8,624.00) $ (9,284.00)<br />
Totals 312 $ 23,402.92 48% $ 443 $ (265) 1.675 149 161 $ 26,522.92 $ 67,503.72 $ 66,013.72 $ (40,980.80) $ (42,590.80)<br />
2001-2004 TY 1 $ 849.38 100% $ 849<br />
1 0 $ 859.38 $ 859.38 $ 849.38 $ - $ -<br />
2001-2004 NG 1 $ 1,040.00 100% $ 1,040<br />
1 0 $ 1,050.00 $ 1,050.00 $ 1,040.00 $ - $ -<br />
2001-2004 HU 4 $ 3,572.00 75% $ 1,628 $ (1,312 1.241 3 1 $ 3,612.00 $ 4,914.00 $ 4,884.00 $ (1,302.00) $ (1,312.00)<br />
Totals 2001 - 2010 4415 $ 279,602.46<br />
2130 2231 $ 323,752.46 $ 1,179,106.72<br />
$ (855,354.26)<br />
2001 - Present Stats 4,416 $ 279,592.46<br />
2,130 2,231 $ 1,179,106.72<br />
$ (855,354.26)<br />
Difference (1) $ 10.00<br />
0 0 $ -<br />
$ -<br />
Totals 2001-2004 1927 $ 142,362.00<br />
926 973 $ 161,632.00 $ 476,253.75<br />
$ (314,621.75)<br />
from sheet 1,928 $ 142,352.00<br />
926 973 $ 476,253.75<br />
$ (314,621.75)<br />
(1) $ 10.00<br />
0 0 $ -<br />
$ -<br />
Totals 2005 + 2,488 $ 137,240.46<br />
1,204 1,258 $ 162,120.46 $ 702,852.97<br />
$ (540,732.51)<br />
from sheet 2,488 $ 137,240.46<br />
1,204 1,258 $ 702,852.97<br />
$ (540,732.51)<br />
0 $ -<br />
0 0 $ -<br />
$ -<br />
CERTIFIED<br />
4,415 $ 279,60 46<br />
2,130 2,231 $ 323,752.46 $ 1,179,106.72<br />
$ (855,354.26)<br />
PAST PERFORMANCE IS NOT INDICATIVE OF FUTURE RESULTS. NO REPRESENTATION IS BEING MADE THAT ANY ACCOUNT WILL, OR IS LIKELY TO, ACHIEVE PROFITS, OR LOSSES SIMILAR TO THOSE SHOWN. THERE IS A RISK OF LOSS IN ALL TRADING.<br />
"HYPOTHETICAL PERFORMANCE RESULTS HAVE MANY INHERENT LIMITATIONS, SOME OF WHICH ARE DESCRIBED BELOW. NO REPRESENTATION IS BEING MADE THAT ANY ACCOUNT WILL OR IS LIKELY TO ACHIEVE PROFITS OR LOSSES SIMILAR TO THOSE SHOWN. IN FACT, THERE ARE FREQUENTLY SHARP<br />
DIFFERENCES BETWEEN HYPOTHETICAL PERFORMANCE RESULTS AND THE ACTUAL RESULTS ACHIEVED BY ANY PARTICULAR TRADING PROGRAM. ONE OF THE LIMITATIONS OF HYPOTHETICAL PERFORMANCE RESULTS IS THAT THEY ARE GENERALLY PREPARED WITH THE BENEFIT OF HINDSIGHT. IN<br />
ADDITION, HYPOTHETICAL TRADING DOES NOT INVOLVE FINANCIAL RISK, AND NO HYPOTHETICAL TRADING RECORD CAN COMPLETELY ACCOUNT FOR THE IMPACT OF FINANCIAL RISK IN ACTUAL TRADING. FOR EXAMPLE, THE ABILITY TO WITHSTAND LOSSES OR TO ADHERE TO A PARTICULAR TRADING<br />
PROGRAM IN SPITE OF TRADING LOSSES ARE MATERIAL POINTS WHICH CAN ALSO ADVERSELY AFFECT ACTUAL TRADING RESULTS. THERE ARE NUMEROUS OTHER FACTORS RELATED TO THE MARKETS IN GENERAL OR TO THE IMPLEMENTATION OF ANY SPECIFIC TRADING PROGRAM WHICH CANNOT BE<br />
FULLY ACCOUNTED FOR IN THE PREPARATION OF HYPOTHETICAL PERFORMANCE RESULTS AND ALL OF WHICH CAN ADVERSELY AFFECT ACTUAL TRADING RESULTS."
CERTIFIED
CERTIFIED
CERTIFIED
Step 7<br />
13<br />
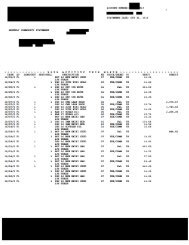
ACCOUNT NUMBER<br />
DATE DEC 31, 2010<br />
* * * * * * * * * * * * * * Y O U R A C T I V I T Y T H I S M O N T H * * * * * * * * * * * * * * * * * * * *<br />
DATE AT LONG/BUY SHRT/SELL DESCRIPTION PRICE/LEGND CC DEBIT CREDIT<br />
12/01/0 F1 1 1 MAR 11 CBOT CORN 01 5.54 /4 US .00<br />
GLOBEX TRADE<br />
12/01/0 F1 1 MAR 11 CBOT CORN 01 5.54 3/4 US 8.42<br />
GLOBEX TRADE<br />
12/01/0 F1 RESIDUAL ON 0001-JAN 11 CBT BE US 1.17<br />
12/01/0 F1 1 JAN 11 CBT BEAN MEAL 01 34 90 US 8.42<br />
GLOBEX TRADE<br />
APS TRADE<br />
12/02/0 F1 1 MAR 11 ICEUS SUGAR11 0 28.61 US 9.36<br />
ICE PLATFORM<br />
12/02/0 F1 RESIDUAL ON 0001-MAR 1 KC WHE US 5.88<br />
12/02/0 F1 1 1 MAR 11 KC WHEAT 08 8.12 US 3,062.50<br />
GLOBEX TRADE<br />
APS TRADE<br />
12/02/0 F1 1 MAR 11 KC WHEAT 08 8.12 US 8.41<br />
GLOBEX TRADE<br />
APS TRADE<br />
12/03/0 F1 1 MAR 11 BOT CO N 01 5.67 US 8.42<br />
GLOBEX TRADE<br />
12/03/0 F1 1 1 MAR 1 ICEUS SUGAR11 06 29.50 US 996.80<br />
ICE PLA FORM<br />
12/03/0 F1 1 MAR 11 ICEU SUGAR11 06 29.50 US 9.36<br />
ICE PLATFORM<br />
12/06/0 F1 RESIDUAL ON 0001-JAN 11 CBT BE US 4.70<br />
12/06/0 F1 1 1 AN 11 CBT BEAN MEAL 01 352.10 US 820.00<br />
GLOBEX TRADE<br />
APS TRADE<br />
12/06/0 F1 1 JAN 11 CBT BEAN MEAL 01 352.10 US 8.42<br />
GLOBEX TRADE<br />
APS TRADE<br />
12/07/0 F1 1 1 MAR 11 CBOT CORN 01 5.57 1/2 US 475.00<br />
GLOBEX TRADE<br />
12/07/0 F1 1 MAR 11 CBOT CORN 01 5.57 1/2 US 8.42<br />
GLOBEX TRADE<br />
12/10/0 F1 RESIDUAL ON 0001-MAR 11 CBOT W US 7.29<br />
12/10/0 F1 1 1 MAR 11 CBOT WHEAT 01 7.80 US 687.50<br />
GLOBEX TRADE<br />
12/10/0 F1 1 1 MAR 11 CBOT WHEAT 01 7.80 US 16.84<br />
GLOBEX TRADE<br />
12/10/0 F1 RESIDUAL ON 0001-MAR 11 KC WHE US 7.24<br />
12/10/0 F1 RESIDUAL ON 0001-MAR 11 KC WHE US 7.24<br />
CERTIFIED
Step 7 14<br />
ACCOUNT NUMBER<br />
DATE DEC 31, 2010<br />
P<strong>AG</strong>E 2<br />
DATE AT LONG/BUY SHRT/SELL DESCRIPTION PRICE/LEGND CC DEBIT CREDIT<br />
12/10/0 F1 1 1 MAR 11 KC WHEAT 08 8.31 1/4 US 375.00<br />
GLOBEX TRADE<br />
APS TRADE<br />
12/10/0 F1 1 1 MAR 11 KC WHEAT 08 8.31 1/4 US 16.82<br />
GLOBEX TRADE<br />
APS TRADE<br />
12/13/0 F1 RESIDUAL ON 0001-MAR 11 CBOT C US 10.15<br />
12/13/0 F1 1 MAR 11 CBOT CORN 01 5.8 /2 US 8.42<br />
GLOBEX TRADE<br />
APS TRADE<br />
12/13/0 F1 RESIDUAL ON 0001-JAN 11 BT BE US 5.78<br />
12/13/0 F1 1 JAN 11 CBT BEAN MEAL 1 342.60 US 8.42<br />
GLOBEX TRADE<br />
APS TRADE<br />
12/14/0 F1 RESIDUAL ON 0001-MAR 11 CBOT W US 1.04<br />
12/14/0 F1 RESIDUAL ON 0001- AR 11 CBOT W US 1.04<br />
12/14/0 F1 1 1 MAR 11 CBOT WHEAT 01 7.70 3/4 US 250.00<br />
GLOBEX TRADE<br />
APS TRADE<br />
12/14/0 F1 1 1 MAR 1 CBOT WHEAT 01 7.75 3/4 US 16.84<br />
GLOBEX TR DE<br />
APS TRA E<br />
12/14/0 F1 RESIDUAL N 0001-MAR 11 KC WHE US 3.29<br />
12/14/0 F1 1 1 MAR 11 KC WHEAT 08 8.18 3/4 US 612.50<br />
GLOBEX TRADE<br />
APS TRADE<br />
12/14/0 F1 1 1 MAR 11 KC WHEAT 08 8.18 3/4 US 17.82<br />
GLOBEX TRADE<br />
APS TRADE<br />
12/15/0 F1 1 1 MAR 11 CBOT CORN 01 5.81 3/4 US 137.50<br />
GLOBEX TRADE<br />
12/15/0 F1 1 MAR 11 CBOT CORN 01 5.81 3/4 US 8.42<br />
GLOBEX TRADE<br />
12/15/0 F1 RESIDUAL ON 0001-JAN 11 CBT BE US 6.31<br />
12/15/0 F1 1 1 JAN 11 CBT BEAN MEAL 01 341.40 US 120.00<br />
GLOBEX TRADE<br />
APS TRADE<br />
12/15/0 F1 1 JAN 11 CBT BEAN MEAL 01 341.40 US 8.42<br />
GLOBEX TRADE<br />
APS TRADE<br />
12/15/0 F1 RESIDUAL ON 0001-MAR 11 CBT BE US 5.26<br />
12/15/0 F1 1 MAR 11 CBT BEAN MEAL 01 344.50 US 8.42<br />
GLOBEX TRADE<br />
APS TRADE<br />
12/15/0 F1 1 MAR 11 ICEUS SUGAR11 06 31.03789470 US 8.11<br />
APS TRADE<br />
CERTIFIED
Step 7<br />
15<br />
ACCOUNT NUMBER<br />
DATE DEC 31, 2010<br />
P<strong>AG</strong>E 3<br />
DATE AT LONG/BUY SHRT/SELL DESCRIPTION PRICE/LEGND CC DEBIT CREDIT<br />
12/16/0 F1 1 1 MAR 11 ICEUS SUGAR11 06 31.10 US 69.56<br />
ICE PLATFORM<br />
12/16/0 F1 1 MAR 11 ICEUS SUGAR11 06 31 10 US 9.36<br />
ICE PLATFORM<br />
12/16/0 F1 RESIDUAL ON 0001-MAR 11 KC WHE 3.29<br />
12/16/0 F1 RESIDUAL ON 0001-MAR 11 KC WHE US 7.89<br />
12/16/0 F1 1 1 MAR 11 KC WHEAT 08 8 02 3/ US 425.00<br />
GLOBEX TRADE<br />
APS TRADE<br />
12/16/0 F1 1 1 MAR 11 KC WHEAT 0 8.02 3/4 US 16.82<br />
GLOBEX TRADE<br />
APS TRADE<br />
12/17/0 F1 RESIDUAL ON 0001-MAR 11 CBT BE US 8.42<br />
12/17/0 F1 1 1 MAR 11 CBT BEAN MEAL 01 350.30 US 580.00<br />
GLOBEX TRADE<br />
APS TRADE<br />
12/17/0 F1 1 MAR 11 CBT BEAN MEAL 01 350.30 US 8.42<br />
GLOBEX TRADE<br />
APS TRADE<br />
12/27/0 F1 CK375 16 BRIAN SCHAD ( CHK ISS US 1,141.67<br />
CHECK ISSUED<br />
**USD-SEG 1.25 F1)** ** CONVERTED TOTAL *<br />
BEGINNING BALANCE 50,825.28 50,825.28<br />
THIS MONTH'S ACTIVITY 25.28- 825.28-<br />
ENDING BALANCE 50 000.00 50,000.00<br />
CERTIFIED<br />
ACCOUNT VALUE AT MARKET 50,000.00 50,000.00<br />
CONVERTED MARKET VALUE 50,000.00 50,000.00<br />
TOTAL COMMISSIONS 169.00- 169.00-<br />
TOTAL CLEARING FEES 1.60- 1.60-<br />
TOTAL EXCHANGE FEES 44.90- 44.90-<br />
TOTAL REGULATORY FEES .26- .26-<br />
TOTAL OTHER FEES 6.60- 6.60-<br />
*** CURRENT MONTH *** *** YEAR-TO-DATE ***<br />
FUTURES PROFIT/LOSS US 316.39 26,141.67