Yum! 2010 Annual Report
Yum! 2010 Annual Report
Yum! 2010 Annual Report

Create successful ePaper yourself
Turn your PDF publications into a flip-book with our unique Google optimized e-Paper software.
Proxy Statement<br />
9MAR201101440694<br />
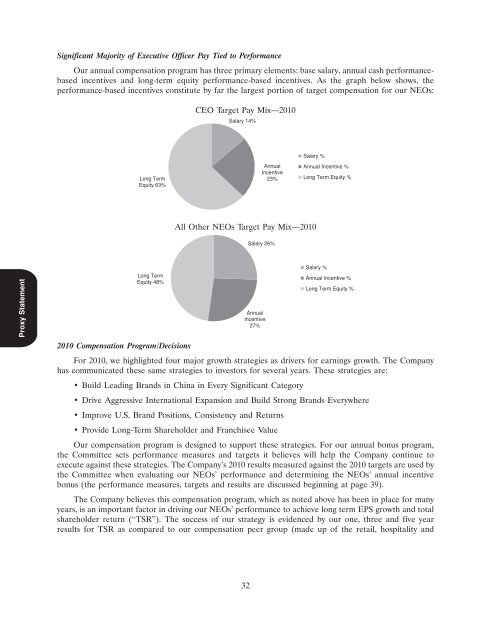
Significant Majority of Executive Officer Pay Tied to Performance<br />
Our annual compensation program has three primary elements: base salary, annual cash performancebased<br />
incentives and long-term equity performance-based incentives. As the graph below shows, the<br />
performance-based incentives constitute by far the largest portion of target compensation for our NEOs:<br />
Long Term<br />
Equity 63%<br />
Long Term<br />
Equity 48%<br />
<strong>2010</strong> Compensation Program/Decisions<br />
CEO Target Pay Mix—<strong>2010</strong><br />
Salary 14%<br />
<strong>Annual</strong><br />
Incentive<br />
23%<br />
Salary %<br />
All Other NEOs Target Pay Mix—<strong>2010</strong><br />
Salary 26%<br />
<strong>Annual</strong><br />
Incentive<br />
27%<br />
<strong>Annual</strong> Incentive %<br />
Long Term Equity %<br />
14MAR201107295096<br />
Salary %<br />
<strong>Annual</strong> Incentive %<br />
Long Term Equity %<br />
14MAR201107295253<br />
For <strong>2010</strong>, we highlighted four major growth strategies as drivers for earnings growth. The Company<br />
has communicated these same strategies to investors for several years. These strategies are:<br />
Build Leading Brands in China in Every Significant Category<br />
Drive Aggressive International Expansion and Build Strong Brands Everywhere<br />
Improve U.S. Brand Positions, Consistency and Returns<br />
Provide Long-Term Shareholder and Franchisee Value<br />
Our compensation program is designed to support these strategies. For our annual bonus program,<br />
the Committee sets performance measures and targets it believes will help the Company continue to<br />
execute against these strategies. The Company’s <strong>2010</strong> results measured against the <strong>2010</strong> targets are used by<br />
the Committee when evaluating our NEOs’ performance and determining the NEOs’ annual incentive<br />
bonus (the performance measures, targets and results are discussed beginning at page 39).<br />
The Company believes this compensation program, which as noted above has been in place for many<br />
years, is an important factor in driving our NEOs’ performance to achieve long term EPS growth and total<br />
shareholder return (‘‘TSR’’). The success of our strategy is evidenced by our one, three and five year<br />
results for TSR as compared to our compensation peer group (made up of the retail, hospitality and<br />
32