Modeling drawdowns and drawups in financial markets - Risk.net
Modeling drawdowns and drawups in financial markets - Risk.net
Modeling drawdowns and drawups in financial markets - Risk.net

You also want an ePaper? Increase the reach of your titles
YUMPU automatically turns print PDFs into web optimized ePapers that Google loves.
64<br />
Beatriz Vaz de Melo Mendes <strong>and</strong> V<strong>in</strong>icius Ratton Br<strong>and</strong>i<br />
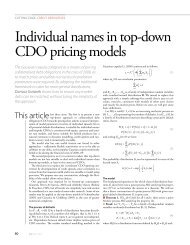
FIGURE 4 QQ-plots of the fitted MGPD (upper row) <strong>and</strong> the stretched exponential<br />
(lower row) of the <strong>drawdowns</strong> (left) <strong>and</strong> <strong>drawups</strong> (right) <strong>in</strong> the case of the Hang<br />
Seng <strong>in</strong>dex.<br />
MGPD fit<br />
Stretched exponential fit<br />
MGPD fit<br />
Drawdowns Drawups<br />
Stretched exponential fit<br />
Drawdowns Drawups<br />
observe the mask<strong>in</strong>g effect. The largest observation had, under the stretched<br />
exponential, an almost perfect fit, at the cost of a poor fit for <strong>drawups</strong> between<br />
13% <strong>and</strong> 24%. The MGPD fitted the whole data set well, spott<strong>in</strong>g a moderate<br />
(24.9%) <strong>and</strong> an extreme outlier (26%).<br />
In summary, for many data sets the stretched exponential provided a poor fit<br />
for a few extreme observations. Accord<strong>in</strong>g to Johansen <strong>and</strong> Sor<strong>net</strong>te (2001), these<br />
atypical observations could belong to a different regime <strong>and</strong> might be considered<br />
outliers. However, for most of these data sets the MGPD was able to provide a<br />
good fit for most of the extreme po<strong>in</strong>ts as well as the bulk of the data. Despite its<br />
improvement, there is still a small percentage of po<strong>in</strong>ts with poor adherence to<br />
the MGPD. We wonder if such po<strong>in</strong>ts could be an effect of long-last<strong>in</strong>g sequences<br />
of drops (rises), or an effect of spurious correlation. Under either assumption they<br />
could be considered outliers.<br />
To complete our analysis, Figure 6 illustrates the different perception of risk<br />
provided by the <strong>drawdowns</strong>. This figure shows <strong>in</strong> the x-axis the exceedance probabilities<br />
(0.002, 0.004, 0.006, 0.008, 0.010, 0.020, 0.030, 0.040) of observ<strong>in</strong>g<br />
URL: www.thejournalofrisk.com Journal of <strong>Risk</strong>