Modeling drawdowns and drawups in financial markets - Risk.net
Modeling drawdowns and drawups in financial markets - Risk.net
Modeling drawdowns and drawups in financial markets - Risk.net

You also want an ePaper? Increase the reach of your titles
YUMPU automatically turns print PDFs into web optimized ePapers that Google loves.
54<br />
Beatriz Vaz de Melo Mendes <strong>and</strong> V<strong>in</strong>icius Ratton Br<strong>and</strong>i<br />
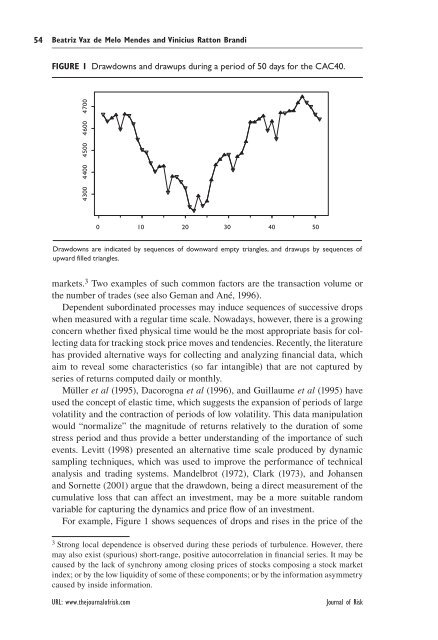
FIGURE 1 Drawdowns <strong>and</strong> <strong>drawups</strong> dur<strong>in</strong>g a period of 50 days for the CAC40.<br />
4300 4400 4500 4600 4700<br />
0 10 20 30 40 50<br />
Drawdowns are <strong>in</strong>dicated by sequences of downward empty triangles, <strong>and</strong> <strong>drawups</strong> by sequences of<br />
upward filled triangles.<br />
<strong>markets</strong>. 3 Two examples of such common factors are the transaction volume or<br />
the number of trades (see also Geman <strong>and</strong> Ané, 1996).<br />
Dependent subord<strong>in</strong>ated processes may <strong>in</strong>duce sequences of successive drops<br />
when measured with a regular time scale. Nowadays, however, there is a grow<strong>in</strong>g<br />
concern whether fixed physical time would be the most appropriate basis for collect<strong>in</strong>g<br />
data for track<strong>in</strong>g stock price moves <strong>and</strong> tendencies. Recently, the literature<br />
has provided alternative ways for collect<strong>in</strong>g <strong>and</strong> analyz<strong>in</strong>g f<strong>in</strong>ancial data, which<br />
aim to reveal some characteristics (so far <strong>in</strong>tangible) that are not captured by<br />
series of returns computed daily or monthly.<br />
Müller et al (1995), Dacorogna et al (1996), <strong>and</strong> Guillaume et al (1995) have<br />
used the concept of elastic time, which suggests the expansion of periods of large<br />
volatility <strong>and</strong> the contraction of periods of low volatility. This data manipulation<br />
would “normalize” the magnitude of returns relatively to the duration of some<br />
stress period <strong>and</strong> thus provide a better underst<strong>and</strong><strong>in</strong>g of the importance of such<br />
events. Levitt (1998) presented an alternative time scale produced by dynamic<br />
sampl<strong>in</strong>g techniques, which was used to improve the performance of technical<br />
analysis <strong>and</strong> trad<strong>in</strong>g systems. M<strong>and</strong>elbrot (1972), Clark (1973), <strong>and</strong> Johansen<br />
<strong>and</strong> Sor<strong>net</strong>te (2001) argue that the drawdown, be<strong>in</strong>g a direct measurement of the<br />
cumulative loss that can affect an <strong>in</strong>vestment, may be a more suitable r<strong>and</strong>om<br />
variable for captur<strong>in</strong>g the dynamics <strong>and</strong> price flow of an <strong>in</strong>vestment.<br />
For example, Figure 1 shows sequences of drops <strong>and</strong> rises <strong>in</strong> the price of the<br />
3 Strong local dependence is observed dur<strong>in</strong>g these periods of turbulence. However, there<br />
may also exist (spurious) short-range, positive autocorrelation <strong>in</strong> f<strong>in</strong>ancial series. It may be<br />
caused by the lack of synchrony among clos<strong>in</strong>g prices of stocks compos<strong>in</strong>g a stock market<br />
<strong>in</strong>dex; or by the low liquidity of some of these components; or by the <strong>in</strong>formation asymmetry<br />
caused by <strong>in</strong>side <strong>in</strong>formation.<br />
URL: www.thejournalofrisk.com Journal of <strong>Risk</strong>