Modeling drawdowns and drawups in financial markets - Risk.net
Modeling drawdowns and drawups in financial markets - Risk.net
Modeling drawdowns and drawups in financial markets - Risk.net

Create successful ePaper yourself
Turn your PDF publications into a flip-book with our unique Google optimized e-Paper software.
56<br />
Beatriz Vaz de Melo Mendes <strong>and</strong> V<strong>in</strong>icius Ratton Br<strong>and</strong>i<br />
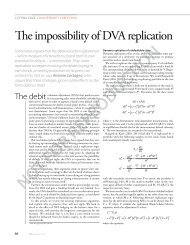
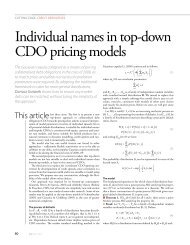
FIGURE 2 Densities of the MGPD with ξ = 0.6 <strong>and</strong> γ = 0.5, 1.0, 1.5, <strong>and</strong> the<br />
stretched exponential for γ = 0.8, 1.0, 1.2, respectively.<br />
0.0 0.1 0.2 0.3 0.4<br />
MGPD<br />
0.5<br />
1.0<br />
1.5<br />
0 2 4 6 8 10 12 14<br />
Both distributions possess scale equal to 3.<br />
0 2 4 6 8 10 12 14<br />
for y ≥ 0, where ψ is the scale parameter <strong>and</strong> γ > 0 is a tun<strong>in</strong>g constant. When<br />
γ =1 we are back to the unit exponential distribution. The class of sub-exponential<br />
distributions is generated by lett<strong>in</strong>g γ < 1. Distributions with γ > 1 are called<br />
super-exponentials. The right-h<strong>and</strong> side of Figure 2 shows the stretched exponential<br />
densities for γ = 0.8, 1, 1.2, <strong>and</strong> scale ψ = 3.<br />
Johansen <strong>and</strong> Sor<strong>net</strong>te (2001) fitted model (1) to several data sets, <strong>in</strong>clud<strong>in</strong>g<br />
<strong>in</strong>dexes, commodities <strong>and</strong> currencies. They found that, typically, this distribution<br />
gives a good fit to the bulk of the data but underestimates between one <strong>and</strong><br />
10 extreme observations. Their conclusion raises the question of whether these<br />
extreme observations should actually be considered outliers, or whether a better<br />
fit could be found for all observations. In fact, the authors considered this issue<br />
<strong>and</strong> commented that the success <strong>in</strong> us<strong>in</strong>g the stretched exponential for fitt<strong>in</strong>g<br />
<strong>drawdowns</strong> does not mean that a better parametrization does not exist. Thus, it<br />
seems natural to look for a flexible distribution from the extreme value theory<br />
suitable for model<strong>in</strong>g long-tailed data.<br />
In the 1990s we saw a large amount of research apply<strong>in</strong>g techniques from<br />
the extreme value theory <strong>in</strong> risk management. Examples <strong>in</strong>clude Long<strong>in</strong> (1996),<br />
Danielsson <strong>and</strong> de Vries (1997), McNeil <strong>and</strong> Frey (2002), Embrechts, Resnick,<br />
<strong>and</strong> Samorodnitsky (1998), among others. Extreme value theory is mostly concerned<br />
with the study of the behavior of extremes from a strictly stationary<br />
stochastic process {X i }, i = 1, 2,…, where all X i has a common distribution F X . A<br />
ma<strong>in</strong> result is the Fisher–Tippett theorem (Fisher <strong>and</strong> Tippett, 1928), which gives<br />
URL: www.thejournalofrisk.com Journal of <strong>Risk</strong><br />
0.0 0.1 0.2 0.3 0.4<br />
Stretched exponential<br />
0.8<br />
1.0<br />
1.2